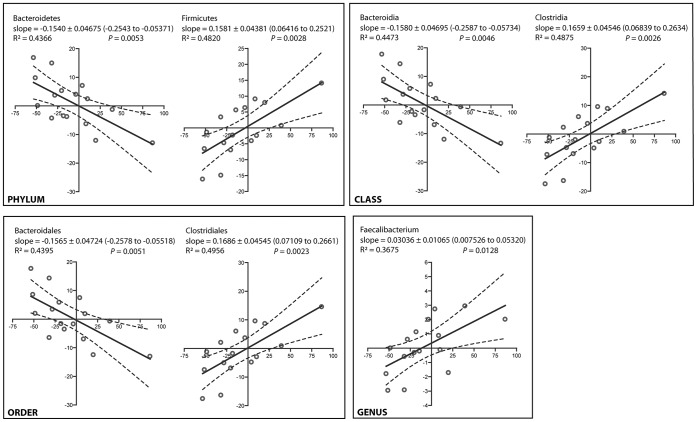
Figure 7. Correlation between the changes in intrahepatic triglyceride content and fecal bacterial abundance in 16 NASH patients over 6 months.
Footnote: The x-axis and y-axis represents changes of intrahepatic triglyceride content and abundance of the indicated bacterial groups in 6 months, respectively. Solid and dashed lines are linear regression fits and 95% confidence bands, respectively.

