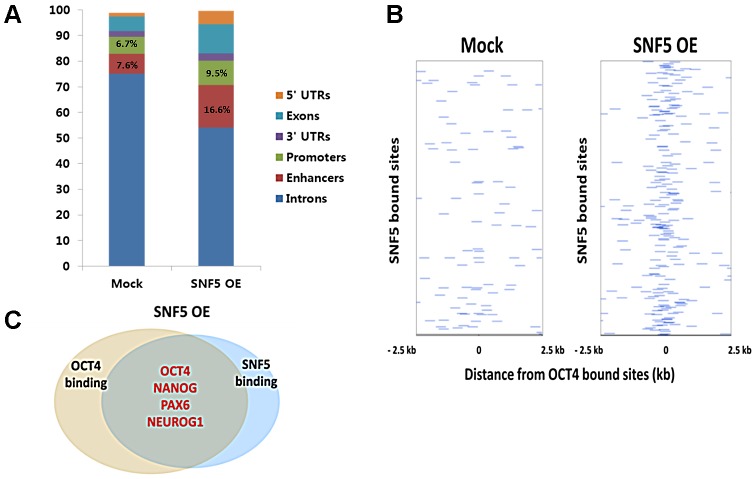
Figure 5. Overexpression of SNF5 alters SNF5 binding distribution, especially to OCT4 target genes.
(A) Percentage distribution of ChIP-seq binding regions for SNF5 in control and overexpression state. (B) The binding plots show the localization of SNF5 bound sites relative to OCT4 bound sites. SNF5 bound sites (y axis) are displayed within a 5 kb window centered on the OCT4 bound site. Intensity at position 0 indicates that site overlap. (C) Venn diagram showing overlapping of OCT4 and SNF5 (the number of OCT4 only binding genes; 3412, the number of SNF5 only binding genes; 7185, and the number of both binding genes; 1862) bound genes after overexpression of SNF5 based on ChIP-seq data in NCCIT cells.

