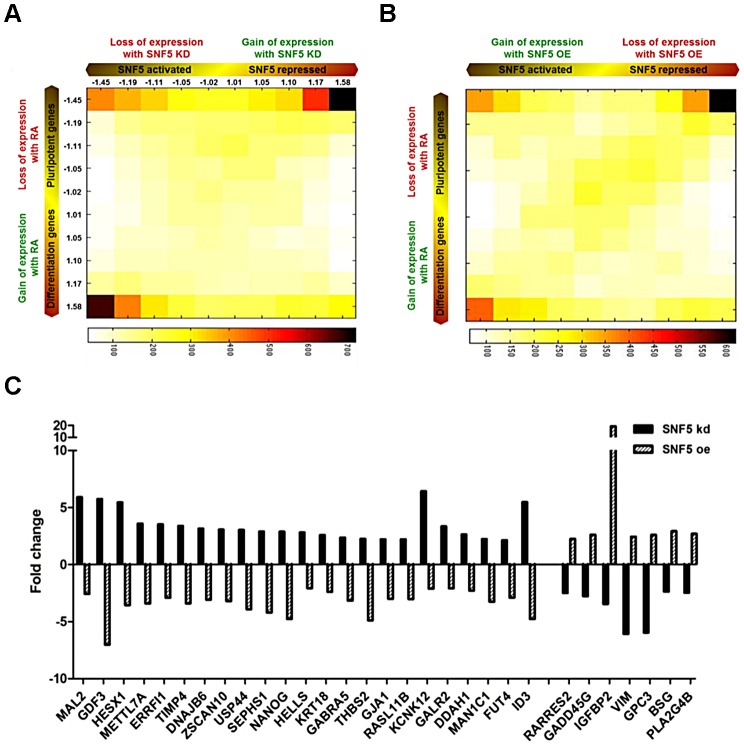
Figure 6. SNF5 controls the balance between pluripotency and differentiation.
(A and B) 2D matrix and heat plots depicting gene expression changes in SNF5 knockdown/SNF5 overexpression and RA 7 d treated NCCIT cells. Axes indicate degree of fold change, from the middle of axis. The numbers indicate the median fold change of genes in each column or row. The intensity of each square represents the number of genes that fall in that square. (C) Fold change of SNF5 target genes (over two fold changes in opposite direction) among previously defined ES signature genes [51].

