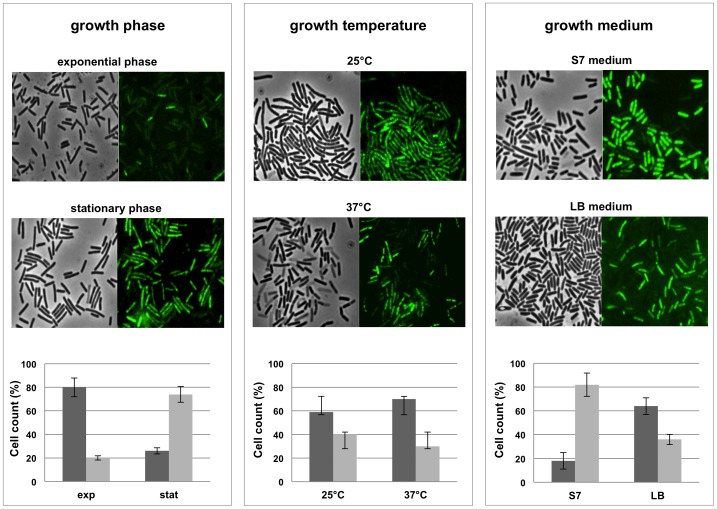
Figure 4. Autofluorescence at different growth conditins.
Microscopy fields of SF214 cells grown at different conditions and observed by phase contrast and autofluorescence and compared to assess the proportion of fluorescent vs not fluorescent cells. Left panel: exponential vs. stationary growth phase (in LB medium at 37°C); middle panel: 25°C vs. 37°C as growth temperature (in LB medium for 24 hours); right panel: minimal (S7) vs. rich (LB) growth medium (stationary cells grown at 25°C). For each panel a graph reports the percentage of fluorescent (gray bars) vs. not fluorescent (dark gray bars) cells. For each condition a total of 1.000 cells from five different microscopy fields were counted. Spores and cells containing a prespore were not counted.

