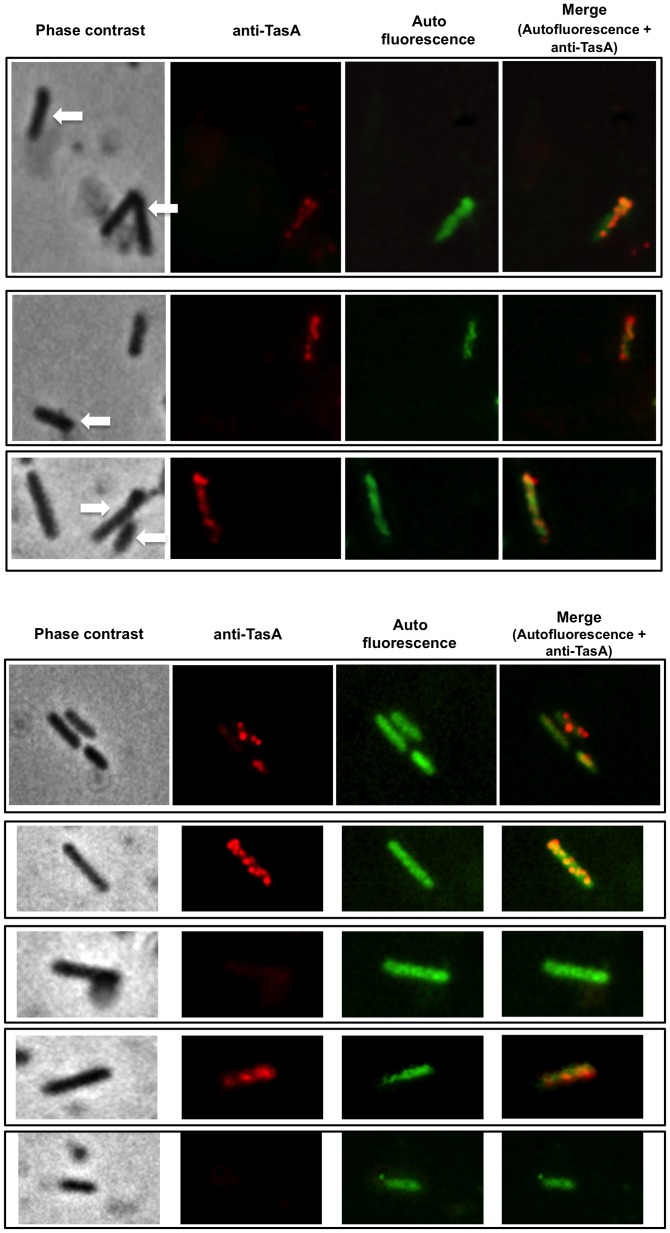
Figure 7. Fluorescence and immunofluorescence microscopy with anti-TasA antibody.
Microscopy analysis of cells from different fields observed by phase contrast, immunofluorescence with anti-TasA primary antibody and Texas Red conjugated secondary antibody and autofluorescence. Merged panels of autofluorescence-immunofluorescence are shown. Panel A reports examples of cells that are not autofluorescent and that are also not recognized by anti-TasA, indicated by arrows. Panel B focuses on examples of autofluorescent cells, with some recognized (yellow in the merge) and some not recognized by anti-TasA antibody.

