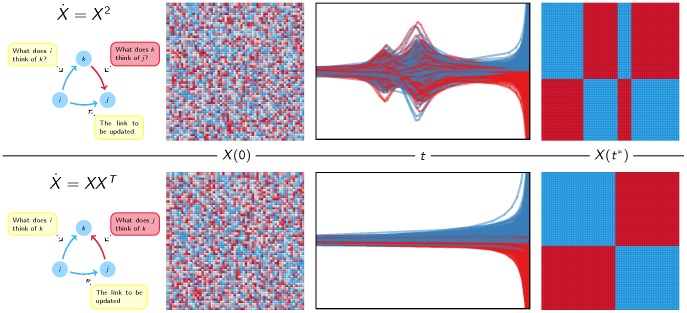
Figure 2. The two models compared.
The first row illustrates what happens generically for the model  , while the second row displays the results for
  . Each row contains from left to right: (1) an illustration of the model; (2) the random initial state; (3) the dynamics of the model; and (4) the final state to which the dynamics converge. Blue indicates positive entries, and red negative entries. Although the first model converges to a rank one matrix, it is not socially balanced. The second model does converge generically to social balance. The small bumps in the dynamics for
  are due to complex eigenvalues that show circular behaviour (see Fig. S1).

