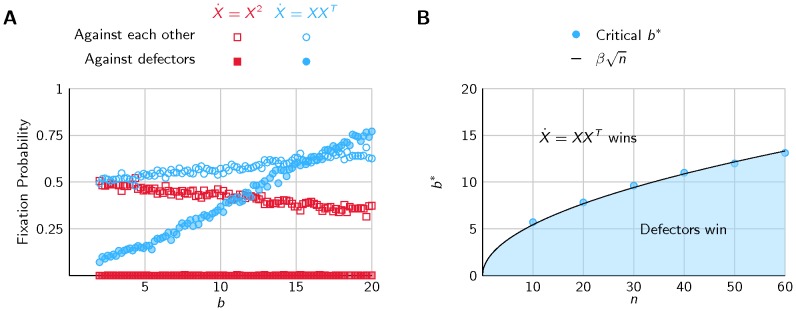
Figure 4. Evolution of Cooperation.

(A) The fixation probability (probability to be the sole surviving species) is higher for model  than
than  . This implies that the model
  is more viable against defectors, and has an evolutionary advantage compared to
  . (B) The point b* at which the model
  has an evolutionary advantage against defectors (i.e. the fixation probability ρ >1/2) depends on the number of agents n. The condition for the model
  to defeat defectors can be approximated by
  , with β ≈ 1.72.
