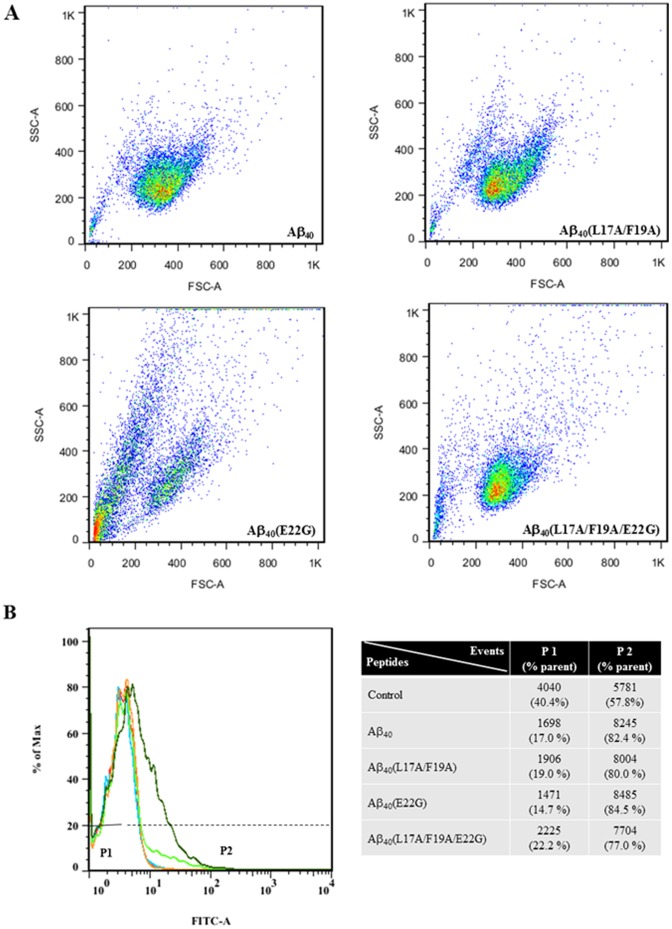
Figure 7. Formation of reactive oxygen species (ROS) by SHSY5Y cells.
(A) Flow cytometry after DCFH-DA staining to measure ROS production of cells treated with 30 µM Aβ peptides for 48 hours. (B) Total cells are 10000 events. P1 and P2 populations are compared with control cells without peptide (red). The histogram showing Aβ40 is blue, Aβ40(L17A/F19A) is orange, Aβ40(E22G) is green, and Aβ40(L17A/F19A/E22G) is olive.

