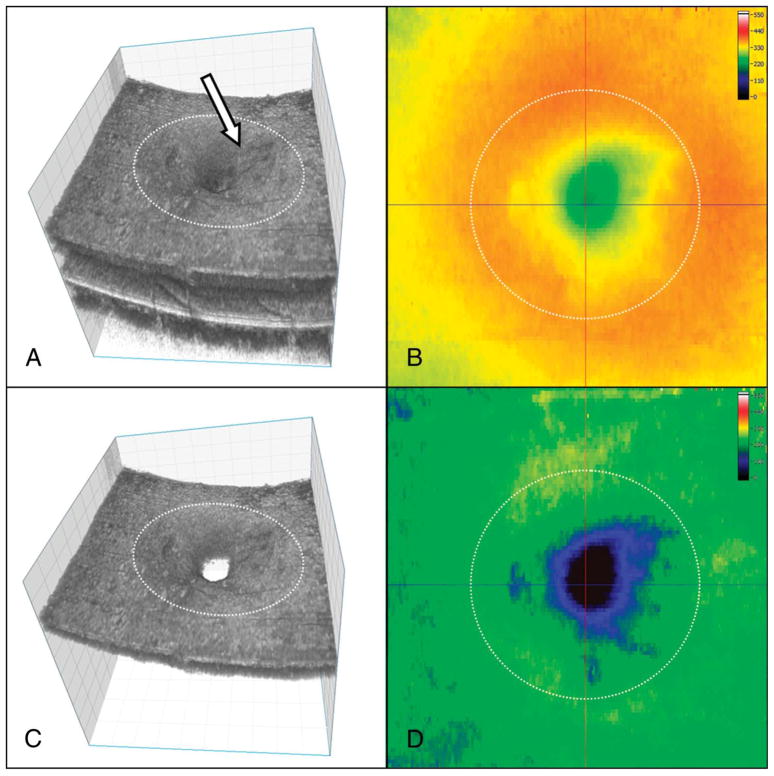
Fig. 1.
High-resolution FD-OCT three-dimensional structure and corresponding thickness maps of the macula of an eye with surgically closed idiopathic macular hole. A. The segmented tMV volumetric data set is shown, from nerve fiber to retinal pigment epithelial layer. Note the retinal surface irregularities (solid white arrow) in this eye that had ILM peeling. B. The corresponding color-coded retinal thickness map for tMV measurement. C. The segmented three-dimensional volumetric data set for iMV, that is, nerve fiber to inner plexiform layer is shown. D. The corresponding color-coded retinal thickness map for iMV measurement. The intersection of the vertical and horizontal black lines on Figure 1B and 1D represents the central fovea. Dashed circle denotes the central 3 mm zone for which macular volume was measured.

