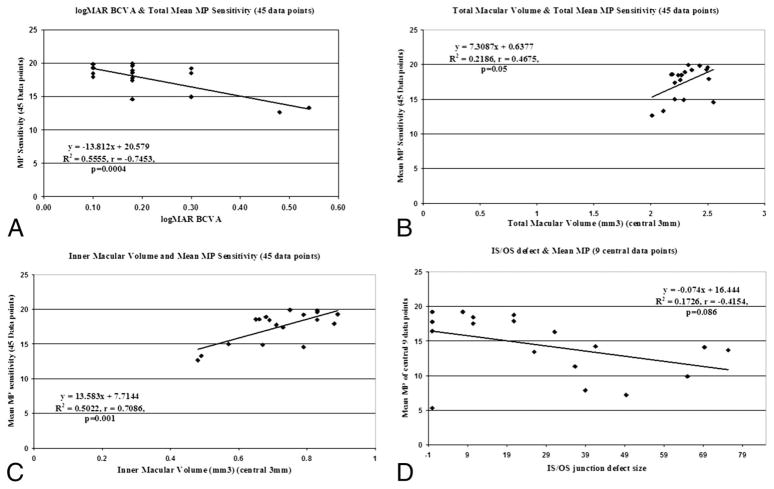
Fig. 5.
Scatterplots showing the correlation between MP-1 sensitivity and logMAR BCVA and FD-OCT parameters for 18 eyes: A. Mean total MP-1 sensitivity (45 data points) and logMAR BCVA, B. Mean total MP-1 sensitivity (45 data points) and tMV, C. Mean total MP-1 sensitivity (45 data points) and iMV, D. Mean central MP-1 sensitivity (9 data points) and foveal photoreceptor IS-OS junction abnormality size.

