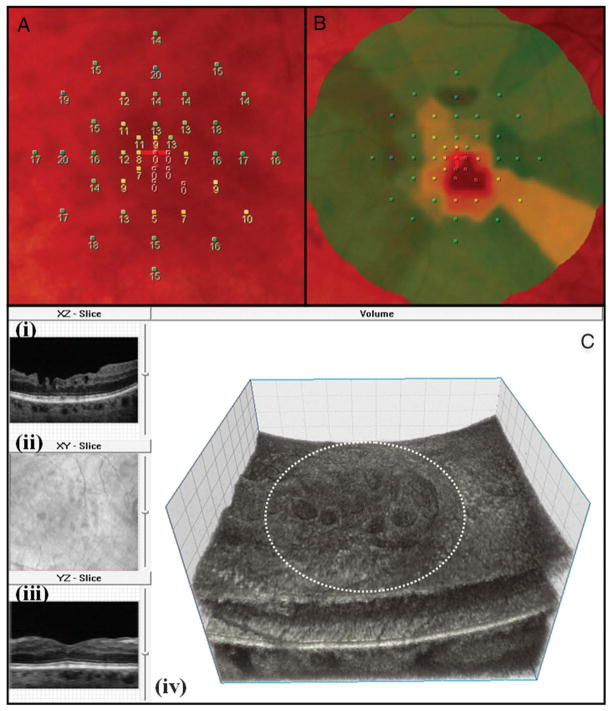
Fig. 6.
MP-1 (8° 10 dB strategy) and high-resolution FD-OCT image of an eye with surgically closed macular hole with ILM peeling. A. MP-1 sensitivity with numerical values for the 45 data points, B. MP-1 sensitivity color map (green denotes normal sensitivity, whereas yellow and orange denotes progressive loss of sensitivity, respectively) and C. the three-dimensional FD-OCT volumetric data set as viewed on volume visualization and image processing software; (i) the B-scan in XZ plane showing macular surface irregularity, (ii) the en face projection view of the volume showing the extent of the macular surface irregularity relative to the retinal vessels, (iii) the “virtual” B-scan in YZ plane reconstructed from volume through section of macula with less surface irregularity and (iv) the three-dimensional FD-OCT volume with surface irregularities. The dashed white circle represents the approximate area over which the MP-1 sensitivity assessment was done. For this eye, the BCVA postoperatively was 20/70, mean total MP-1 sensitivity of 45 data points was 13.30 dB and mean central MP-1 sensitivity of 9 data points was 5.33 dB and tMV and iMV for central 3 mm was 2.11 mm3 and 0.49 mm3, respectively. This is an example of an eye with poor MP-1 sensitivity and macular surface abnormality on FD-OCT B-scan. As shown, there is some correlation between the area of the macula with decreased sensitivity on MP-1 and the area of the macula with surface irregularity on FD-OCT.

