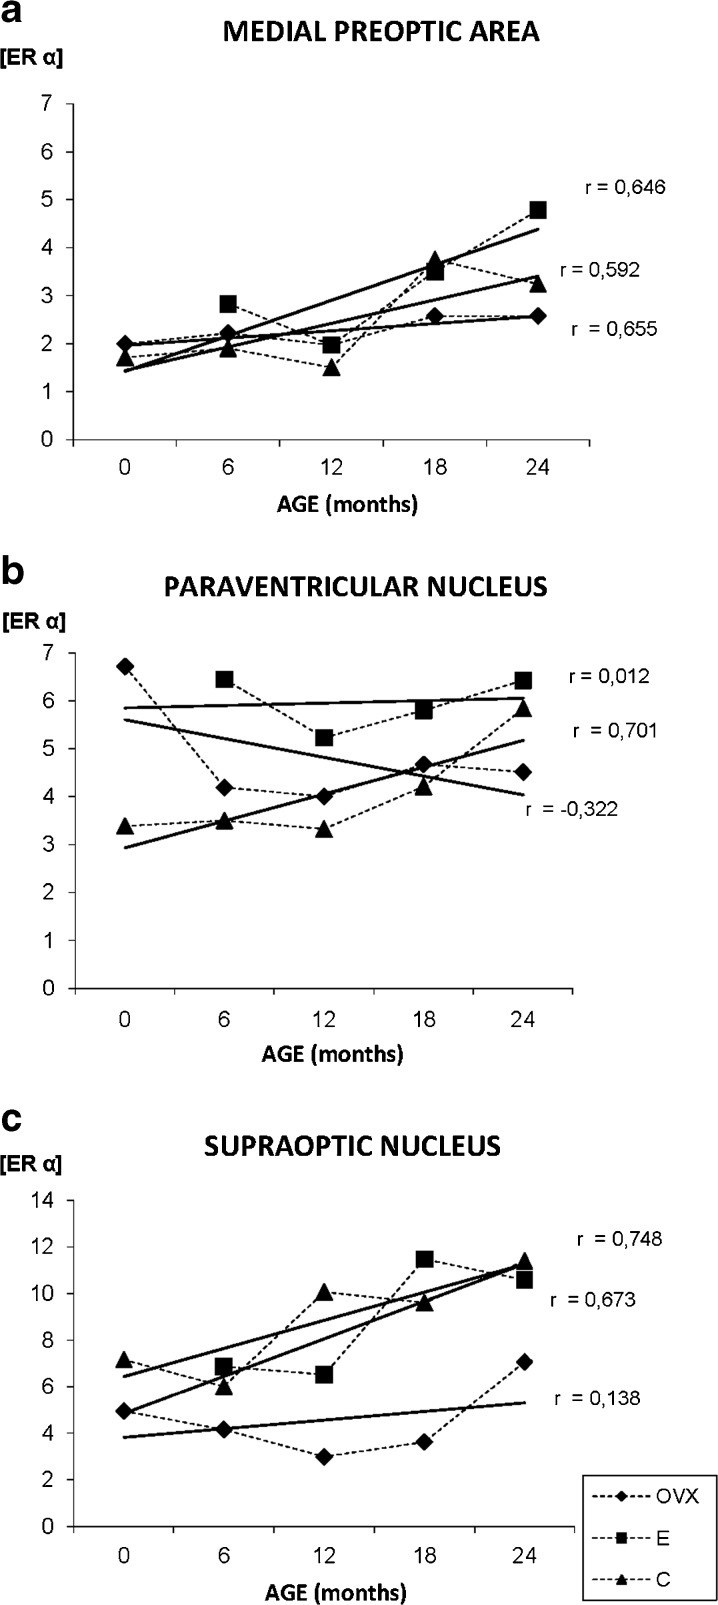
Fig. 8.
Densitometric quantification of ERα immunosignal in the medial preoptic area, paraventricular, and supraoptic nuclei along aging in the three experimental groups: control (C), ovariectomized (OVX), and estradiol treated (E) animals in different age groups (months). Each point in the graph represents mean density in a × 20 field ± standard error of the mean. Regression lines and Pearson’s correlation coefficient (r) are also shown

