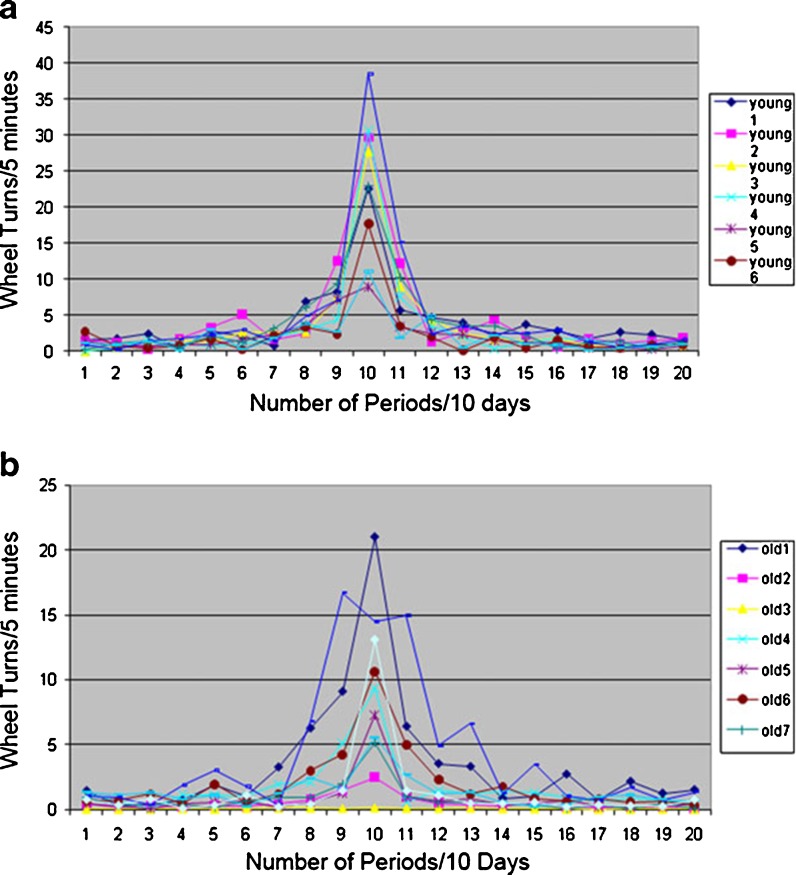
Fig. 2.
Biological aging and regularity of peak physical activity. Fourier analysis was performed on the wheel-running activity of cohorts (n = 6–7) young adult (a) and old (b) mice collected over 4 weeks under constant darkness conditions. The resulting periodogram shows discrete harmonic components (number of complete cycles over the period of observation) on the X-axis vs. intensity of exercise on the Y-axis. Integral values on the X-axis correspond to the number of periods completed over a 10-day cycle. Thus, an X value of 1 corresponds to a single period of 10 days length, a value of 10:10 periods of 24-h length, and a value of 20:20 periods of 12-h length. Integral values on the Y-axis correspond to wheel turns per 5 min bins. While the cohort of younger animals retained a tightly regulated peak activity period (resulting in consistent 10 peaks over 10 days and thus dominating peak in the center of periodograms a), there was significantly greater drift in the older cohort (less regular exercise pattern resulting in “erosion” of a single dominating peak of periodograms b)

