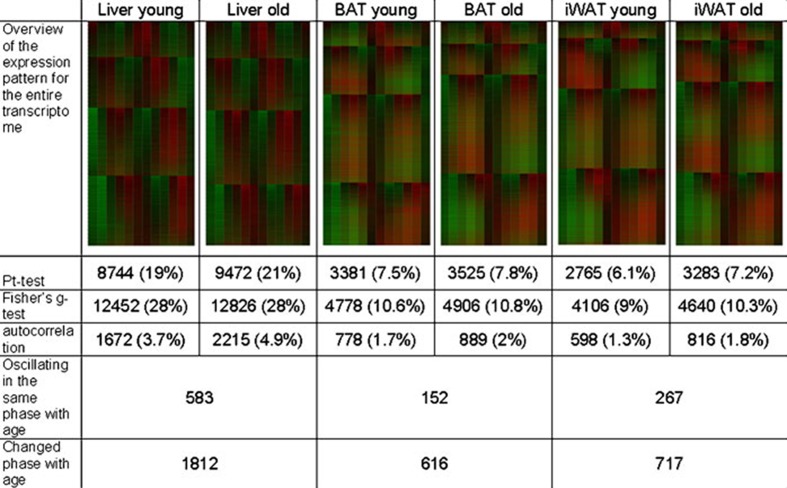
Fig. 4.
Biological aging and the circadian oscillation of the transcriptome in BAT, iWAT, and Liver. The heat map of genes in BAT, iWAT, and liver is organized into genes oscillating in phase with peak (zenith) expression levels at circadian time CT 0 (light onset), CT 4 (4 h after light onset), CT 8 (8 h after light onset), and CT 16 (4 h after light offset). The number of expressed oscillating genes detected by the three algorithms (permutation (Pt), Fishers g test, or autocorrelation) are indicated along with the percentage and number of genes maintaining the same phase or different phase between age groups

