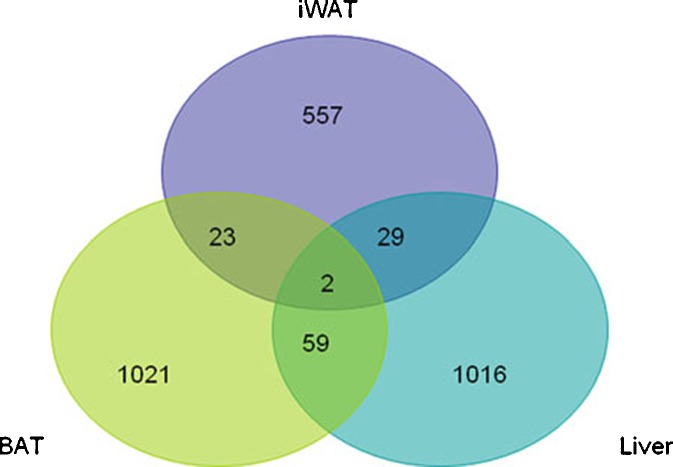
Fig. 5.
Biological age-dependent mRNA expression levels in the transcriptome of BAT, iWAT, and liver. A Venn diagram depicts the number of independent transcripts differentially expressed between young and old cohorts within each tissue; the areas of overlap depict the number of genes with a shared differential expression profile between two or more tissues

