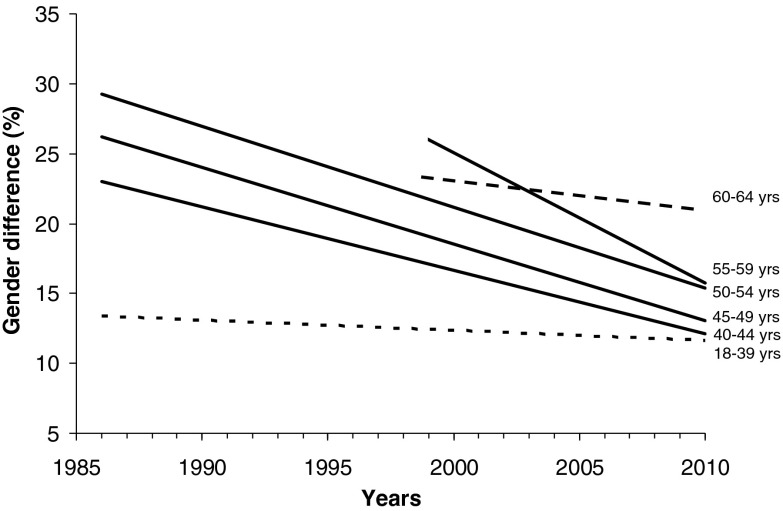
Fig. 5.
Linear regressions defining gender differences in total times within different age groups across the period of 1986 through 2010. Solid lines represent conditions where the slopes of the linear regressions were significantly different (P < 0.01) from zero. Dashed lines indicate the slopes of the linear regressions were not significantly different from zero. Lines traverse only the range of years for which data were considered

