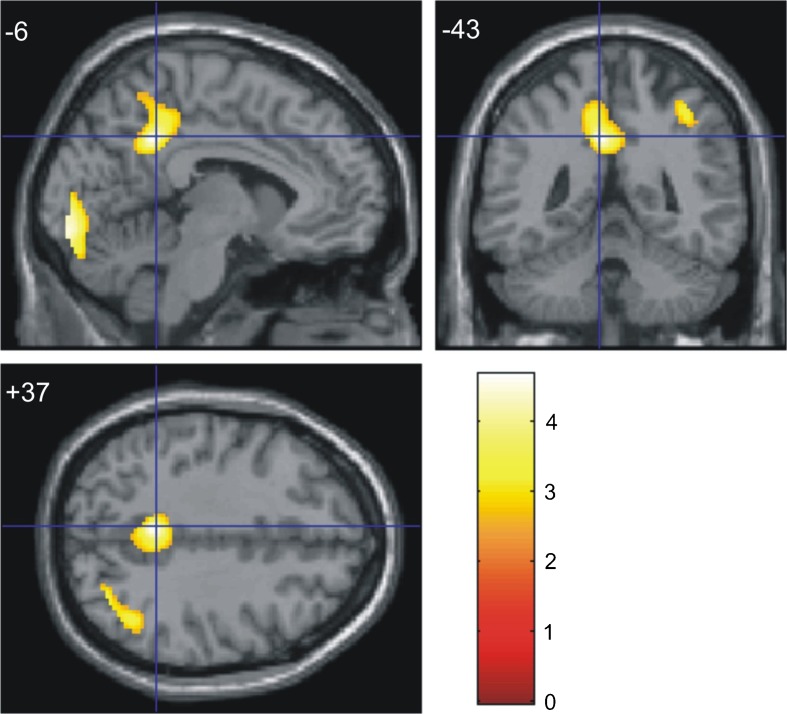
Fig. 1.
Brain pattern of reduced FDG uptake in the high-risk group in comparison to the low-risk group. Results of the whole-brain search of significant cerebral metabolic rate for glucose metabolism reductions in the high-risk group (n = 20) in comparison to the low-risk group (n = 17), controlled to apolipoprotein ε4 status (at the Z > 2.33 threshold, corresponding to p < 0.01). Foci of significance were overlaid on sagittal (x), coronal (y), and transaxial (z) brain slices of a structural magnetic resonance imaging scan spatially transformed into an approximation to the Talairach and Tournoux (1988) stereotactic atlas with a cross hair marking the location of the average peak coordinate as indicated by numbers (x = −6, y = −43, y = +37) in millimeters. Statistical voxel values have been thresholded at Z = 2.33 (corresponding to p < 0.01, uncorrected for multiple comparisons). The brain regions where hypoactivity (clusters highlighted in yellow) in the high-risk group had been hypothesized a priori, and which showed significant differences between the two groups (at the 0.05 level after family-wise error correction for multiple comparisons, using the small volume correction tool in Statistical Parametric Mapping), were the left precuneus and the left posterior cingulate gyrus. The coordinates of voxels of maximal statistical significance in each cluster, as well as their size, peak Z-scores, and associated p values, are provided in Table 3. The color bar represents T-values

