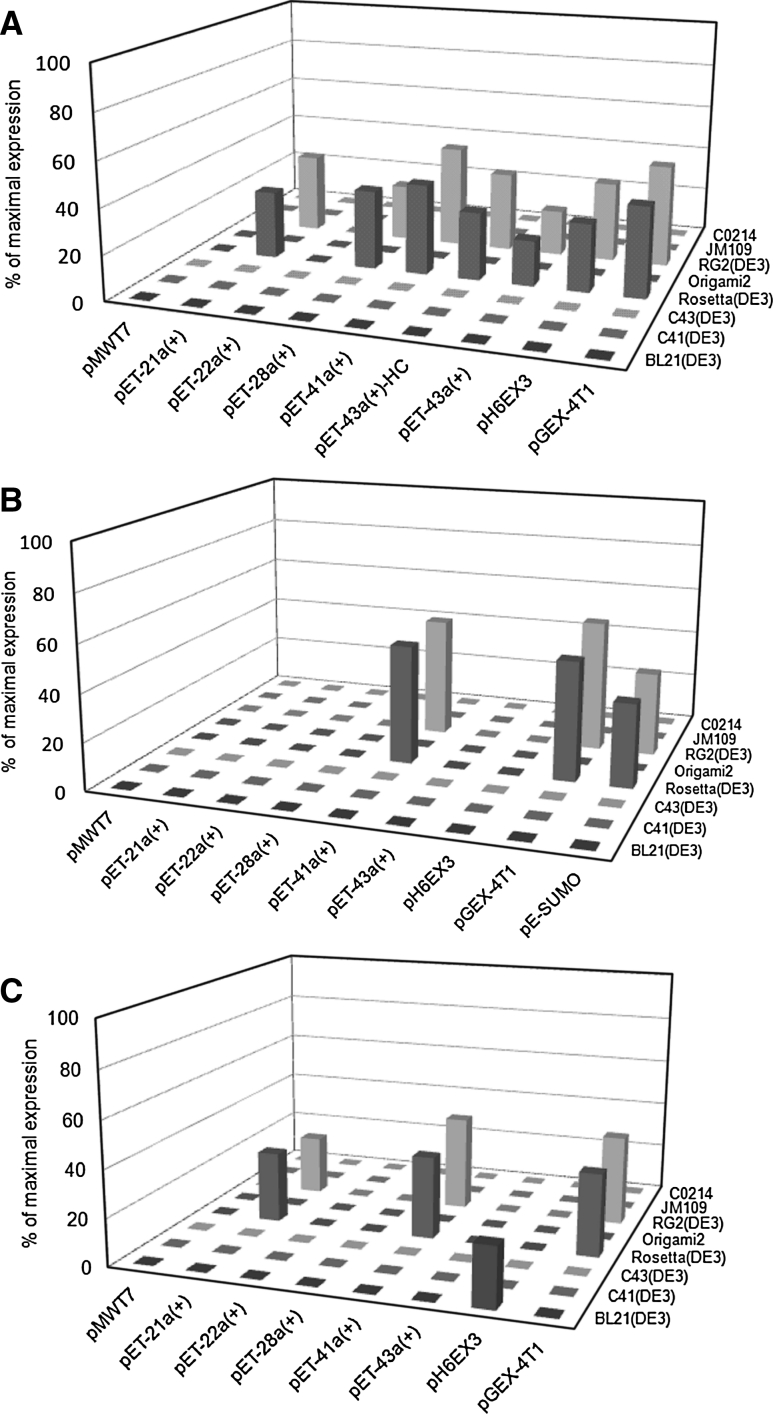
Fig. 2.
Screening of cell strains and plasmids for expression of OCTN proteins. Tridimensional representation of screening experiments for a hOCTN1, b hOCTN2, and c mOCTN3, in which different E. coli strains have been transfected with constructs obtained with each of the indicated plasmid. Strains are indicated by the commercial names except for RG2(DE3) which is the abbreviation of RosettaGami2(DE3). The histograms represent the expression level as percent of the maximal expression obtained for each of the protein [39, 50, 51] after optimization of all the experimental conditions

