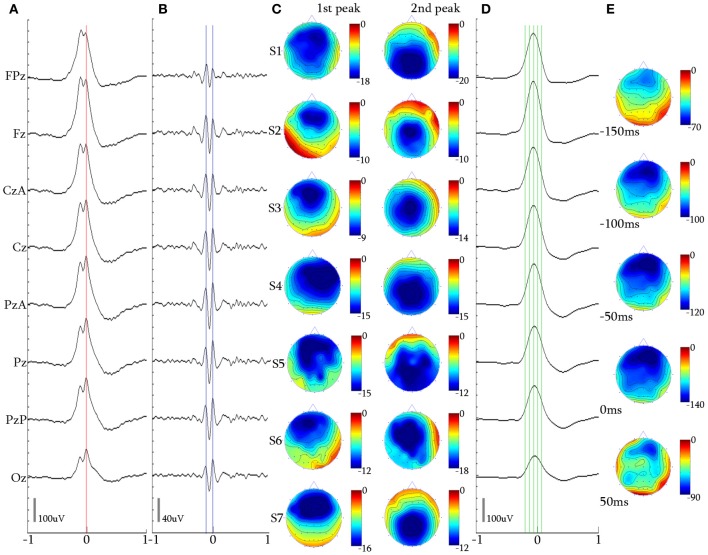
Figure 4.
2-peak iKCo. (A) Waveform averaged KC—unfiltered EEG signal of subject 1. (B) 5 Hz high-pass filtered waveform of the averaged KC signal of the same subject. It can be noted that the first and second waves have maximal power in the frontal and occipital leads, respectively. (C) Topographic analysis in 2D electrode space for all subjects (S1–S7) of the 1st and 2nd peaks of the iKCo. The first wave in all subjects was maximum frontally and the second either parietally or occipitally. (D) 4 Hz low-pass filtered waveform of the averaged KC signal of subject 1. (E) Topographic analysis in 2D electrode space of the averaged slow KC wave, representing the KCs that contained 2-peak iKCo of subject 1 at the times marked by the green cursor in (D) [Red cursor: marked reference of the 2nd peak for waveform averaging, Blue cursors: marked peaks for the topographic analysis in (C)], Color bar units are in uV. Horizontal axis units of (A,B, and D) are in seconds.

