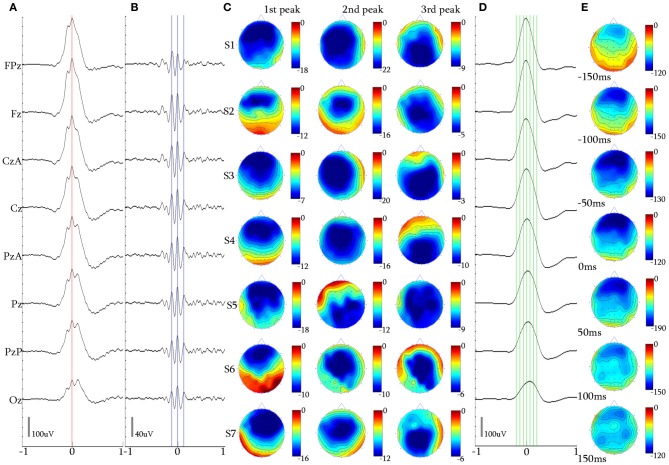
Figure 5.
3-peak iKCo. (A) Waveform averaged KC—unfiltered EEG signal of subject 1. (B) 5 Hz high-pass filtered waveform of the averaged KC signal, of the same subject. (C) Topographic analysis in 2D electrode space for all subjects (S1–S7) of the 1st, 2nd, and 3rd peaks of the iKCo. Note than maximal power of the first, second and third wave was, respectively, located in frontal, central and parietal areas—with the exception of subject 5 where it was frontal-parietal-central. (D) 4 Hz low-pass filtered waveform of the averaged KC signal, of subject 1 at the times marked by the green cursor in (D). (E) Topographic analysis in 2D electrode space of the averaged slow KC wave, representing the KCs that contained 3-peak iKCo (cursors and axis as in Figure 4).

