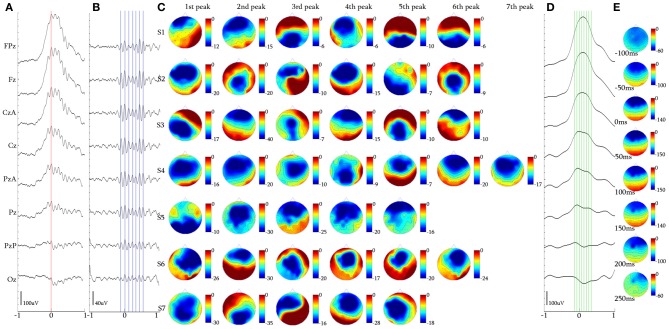
Figure 7.
Alpha KCs. (A) Waveform averaged KC signal—unfiltered EEG signal of subject 4. (B) 5 Hz high-pass filtered waveform of the averaged KC signal. (C) Topographic analysis in 2D electrode space for all subjects (S1–S7) of the 1st–7th peak of the alpha oscillation. (D) 4 Hz low-pass filtered waveform of the averaged KC signal. (E) Topographic analysis in 2D electrode space of the averaged slow KC wave, representing the KCs crowned with alpha waves (cursors and axis as in Figure 4).

