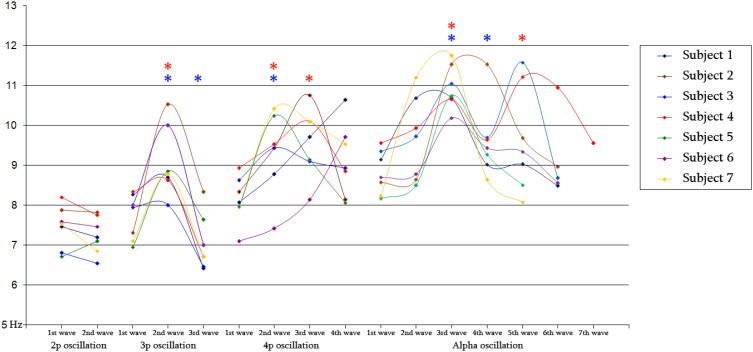
Figure 8.
Diagram of mean frequency values for 2-peak (N = 348/386), 3-peak (N = 308/344) and 4-peak (N = 52/56) iKC oscillations, as well as for iKC alpha rhythmic activity, as they appear on Table 2, for all subjects. Blue and red stars denote a statistically significant change of mean instantaneous frequency compared to that of the preceding wave and that of the 1st wave, respectively.

