
Table 2.
Topographical and numerical results of direction of propagation, wave duration and inferred frequency for each wave of the averaged and high-pass filtered 2-peak, 3-peak, 4-peak iKCo, and iKC alpha, for each subject, where applicable, in black.
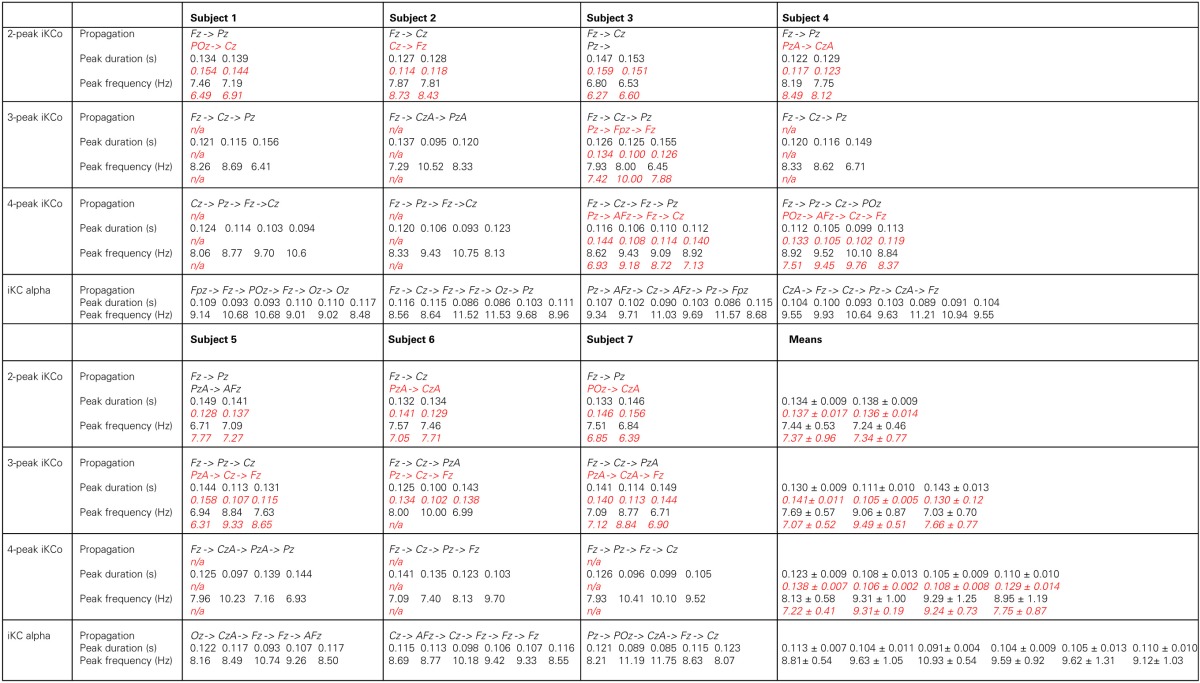
In red, appear the same results for KC populations that exhibited inverse topographical shift patterns. Mean values ± SD appear on the last column.