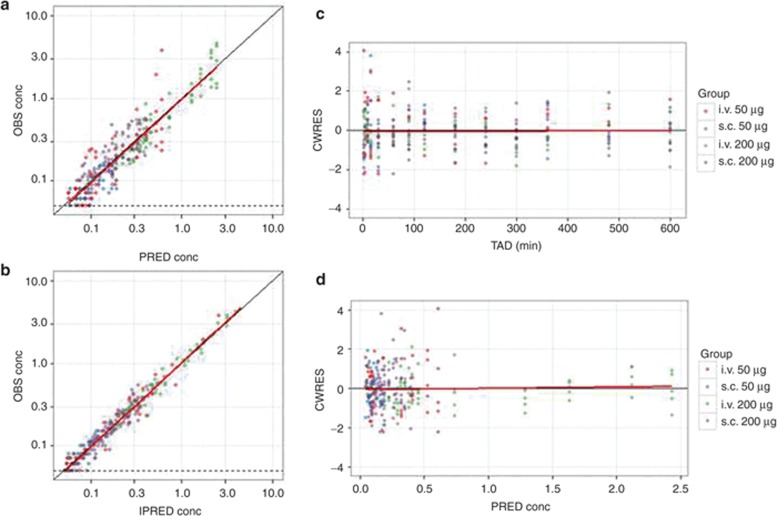
Figure 6.
Key diagnostic plots. Key diagnostic plots for an hypothetical data set for fentanyl given by two routes (i.v., s.c.) and two doses (50 and 200 µg) in 20 patients. In each plot, symbols are data points, the solid black line is a line with slope 1 or 0 and the solid red line is a Loess smoothed line. The LLOQ of the assay (0.05 ng/ml) is shown where appropriate by a dashed black line. (a) Observed concentration (OBS) vs. population-predicted concentration (PRED). Data are evenly distributed about the line of identity, indicating no major bias in the population component of the model. (b) OBS vs. individual-predicted concentration. Data are evenly distributed about the line of identity, indicating an appropriate structural model could be found for most individuals. (c) Conditional weighted residuals (CWRES) vs. time after dose (TAD). Data are evenly distributed about zero, indicating no major bias in the structural model. Conditioning the plots with color on group helps detect systematic differences in model fit between the groups (that may require revision to the structural model or a covariate). (d) CWRES vs. population-predicted concentration. Data are evenly distributed about zero, indicating no major bias in the residual error model. CWERS, conditional weighted residuals; IPRED, individual-predicted concentration; LLOQ, lower limit of quantification; OBS, observed; PRED, predicted; TAD, time after dose.

