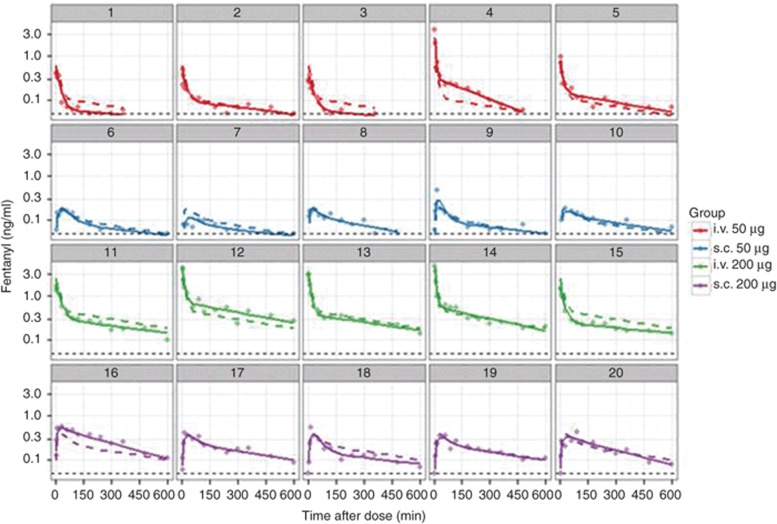
Figure 7.
Goodness of fit plots. Goodness of fit plots for an hypothetical data set for fentanyl given by two routes (i.v., s.c.) and two doses (50 and 200 µg) in 20 patients. Each panel is data for one patient. Symbols are observed drug concentrations, solid lines are the individual-predicted drug concentrations and dashed lines are the population-predicted drug concentrations. The LLOQ of the assay (0.05 ng/ml) is shown as a dashed black line. Each data set and model will require careful consideration of the suite of goodness of fit plots that are most informative. When plots are not able to be conditioned on individual subjects, caution is needed in pooling subjects so that information is not obscured and to ensure “like is compared with like”. LLOQ, lower limit of quantification.

