Figure 5.
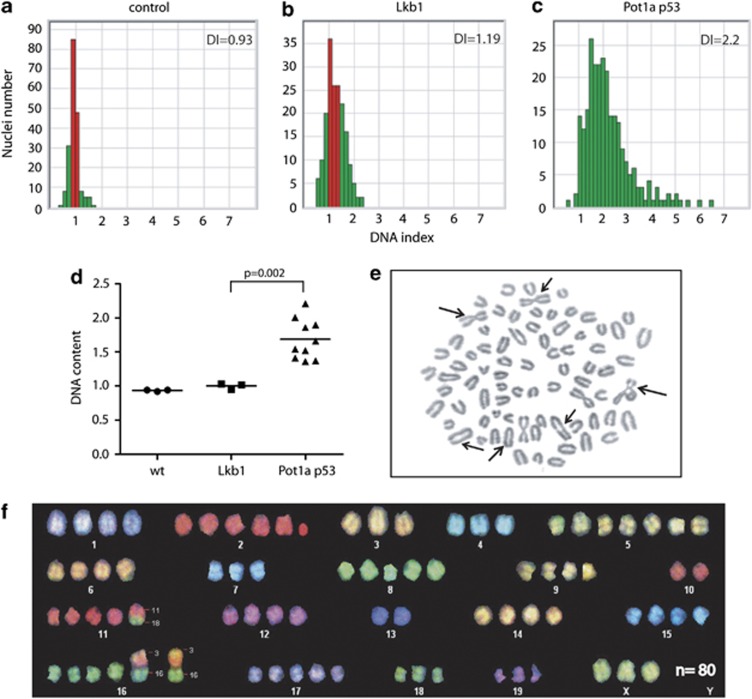
Pot1a p53 tumors exhibit chromosomal instability. (a–c) Ploidy determinations of interphase nuclei by image analyses of Feulgen-stained tissue sections. (a) Uterus from 20-week-old Pot1aL/L control mouse. (b) Uterine tumor from 20-week-old Sprr2f-Cre; Lkb1L/L mouse. (c) Uterine tumor from Sprr2f-Cre; Pot1aL/L; p53L/L mouse. DNA index (DI) represents ratio of analyzed DNA content to reference nuclei in GO/G1 phase. (d) Summary of interphase ploidy analyses. Average DNA indices are shown for each genotype. (e) Metaphase spread from cultured cells derived from an Sprr2f-Cre; Pot1aL/L; p53L/L tumor. Arrows show fused bi-armed chromosomes. (f) Spectral karyotype of this cell line shows aneuploidy (near-tetraploidy) and reciprocal translocations.

