
Figure 2.
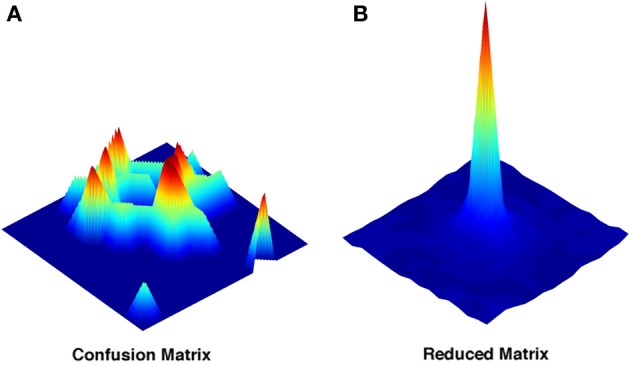
Representative examples of the full and of the reduced confusion matrix. (A) Decoding probability distribution for a single location extracted from the complete confusion matrix. (B) Decoding probability distribution obtained from the reduced matrix. Both are obtained with a sample size of N = 4. Color coding just reflects the relative heights of the points in the probability distributions.