
Figure 3.
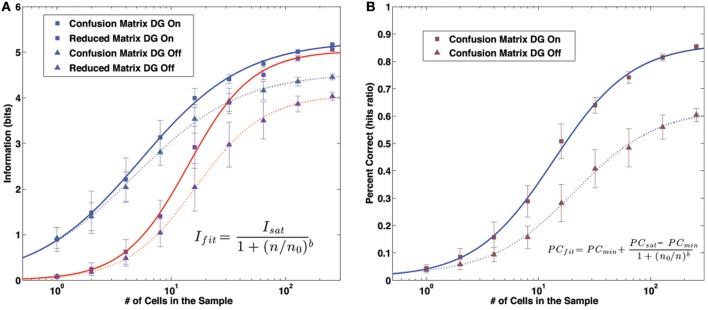
Information and Percent Correct dependence on sample size. (A) Information values. Markers: model data. Lines: fit curves. Gray markers/blue lines: information content of the confusion matrix. Purple markers/red lines: information content of the reduced matrix. Square markers/solid lines: results with the DG input active. Triangular markers/dashed lines: results without the DG input. (B) Percent Correct values. Markers: model data. Lines: fit curves, as in (A).