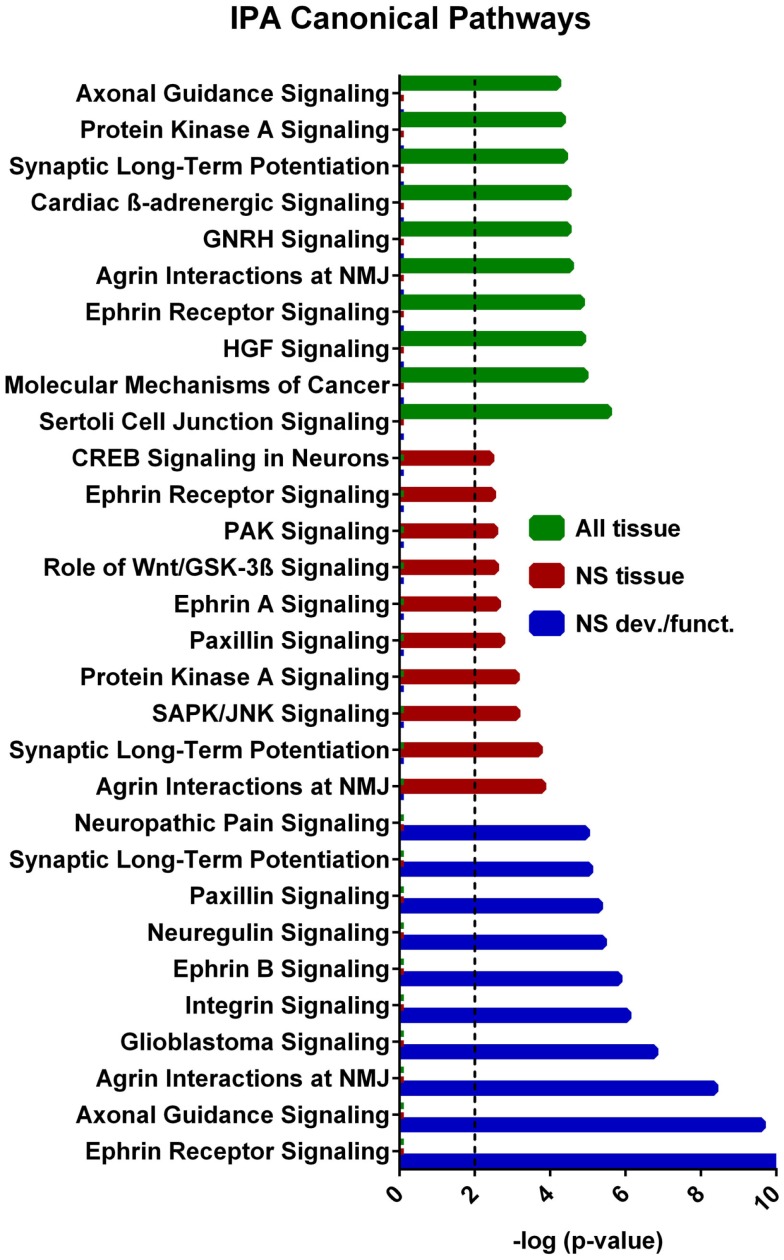
Figure 4.
IPA canonical pathway analyses from each tier of core analysis. The X axis represents negative log p values based on the probability that molecules in the uploaded dataset were included the predefined IPA canonical pathways by true association as opposed to inclusion of molecules based on chance alone. Pathways not involved in nervous system were removed from the nervous system tissue analysis and nervous system development and function graphical displays. Only the top 10 pathways with the largest negative log p values are shown. The dashed line indicates the threshold of significance for a p value of 0.01. GNRH, gonadotropin-releasing hormone; HGF, hepatocyte growth-factor; NMJ, neuromuscular junction.

