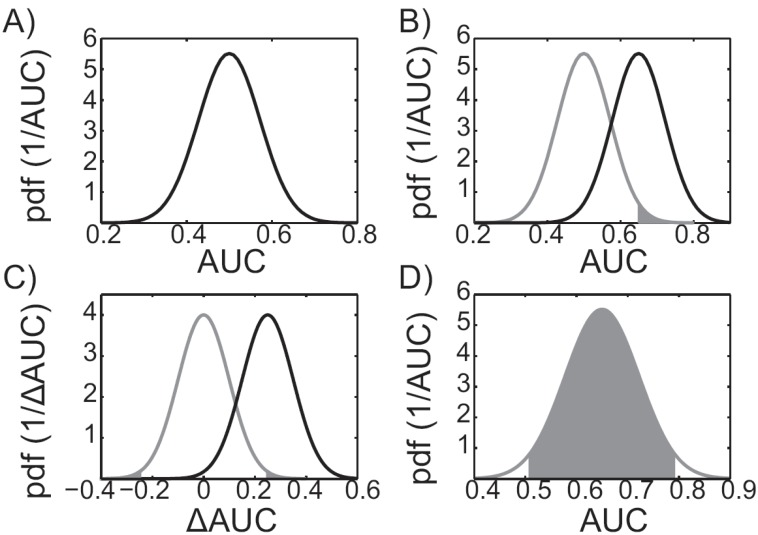
Fig. (3).
Performance evaluation statistics. A) Distribution of a virtual screening protocol that performs randomly, on average. B) An example p-value for a hypothetical virtual screening experiment with an AUC of 0.65 is illustrated as the shaded area under the null distribution, shown in grey. The alternative distribution, corresponding to the alternative hypothesis, is shown in black. C) The null distribution corresponding to the null hypothesis, “the two docking protocols perform identically,” is shown in grey. The p-value corresponding to two virtual screening experiments whose ΔAUC value is 0.25 is illustrated as the shaded areas under the grey null-distribution curve. The corresponding alternative distribution is shown in black. D) The 95% confidence interval of a hypothetical virtual screening protocol with an observed AUC value of 0.65. The 95% confidence interval is bounded by the grey shaded region, which contains 95% of the distribution.

