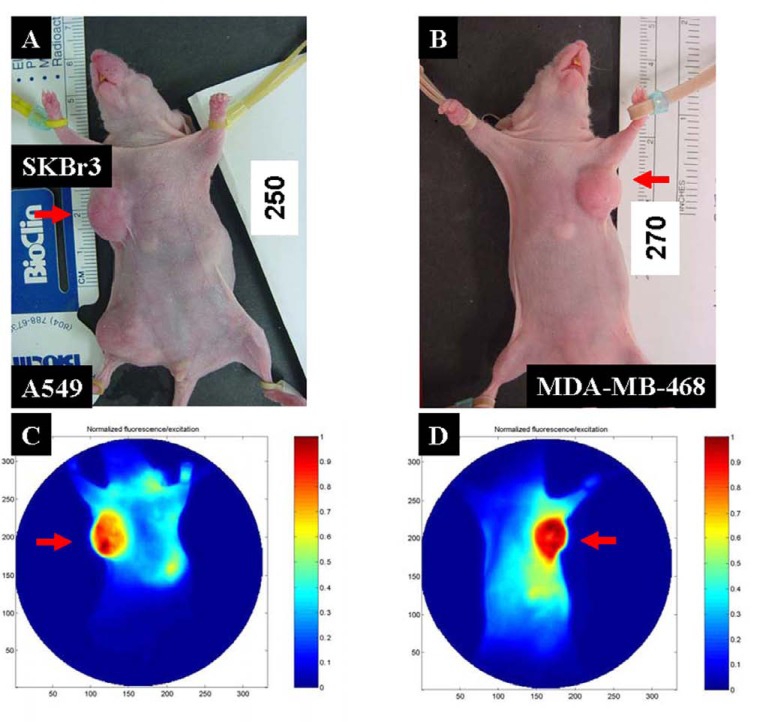
Fig. (7).
MMP agent imaging of human breast cancer xenografts. (A) Visible images showing the location of the tumors and the MMP-positive tumors (SKBr3), indicated by red arrows. (B) Visible image showing the location of location of human breast cancer xenograft of MDA-MB-468 cells. (C) NIR image showing that the MMP-positive tumor had a higher signal intensity than MMP-negative tumor (A549). (D) The MMP agent shows strong binding to the MDA-MB-468 cell xenograft tumor.
(For interpretation of the references to color in this figure legend, the reader is referred to the web version of this paper).

