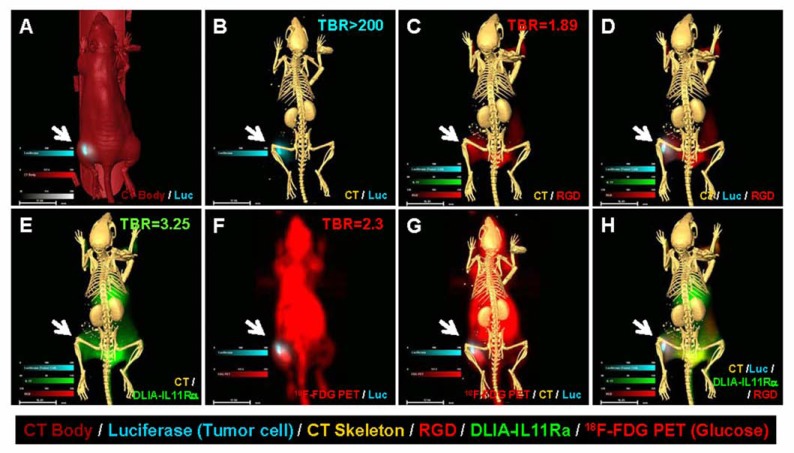
Fig. (9).
In vivo multi-agent images of human breast cancer xenografts. (A) Luciferase (blue) and CT body image (red) of MDAMB- 231 xenograft. (B) Luciferase (blue) cell growth pattern and CT skeleton image. (C) CT skeleton (yellow) and vasculature agent RGD (red) show the hypervascularization stage at the tumor site. (D) Merged luciferase, RGD, and skeleton image showing an uneven distribution of luciferase signal in the tumor. There is a positive correlation between luciferase and RGD agent signal intensities, suggesting that tumor growth requires neovascularization. (E) The human breast cancer xenograft has high DLIA-IL11Rα signal intensity. (F) 18F-FDG glucose uptake in luciferase-positive MDA-MB-231 xenograft. (G) Merged images of CT skeleton, 18F-FDG, and luciferase showing the tumor location and glucose uptake state. Note that some tumor cells remain luciferase-positive, but most have become luciferase-negative at this stage. (H) Merged image of CT skeleton, RGD, luciferase, and DLIA-IL11Rα staining demonstrates the relationship between of tumor location, tumor cell heterogeneity, neovasculature, and location of disease markers.

