
Fig. 4.
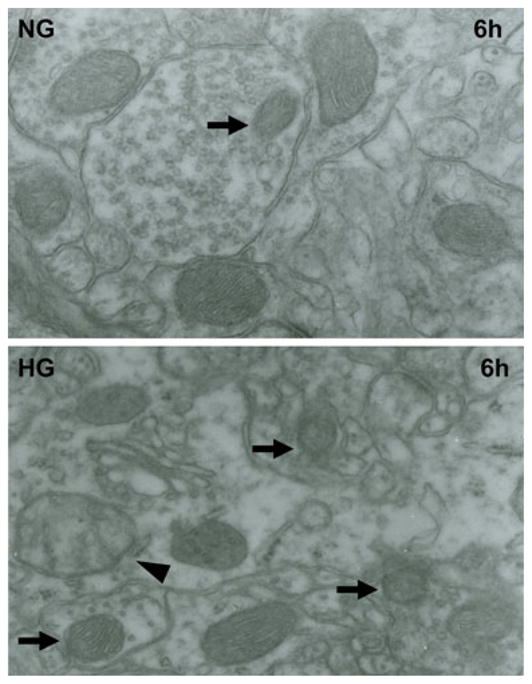
Representative electron micrographs of neuron form cortical area of the brains in normoglycemic and hyperglycemic animals after 6 h of reperfusion. Arrow indicates varying mitochondrial size whereas arrowhead shows mitochondrial swelling and disarrayed cristae. NG normoglycemic, HG hyperglycemic, 6 h 6 h reperfusion