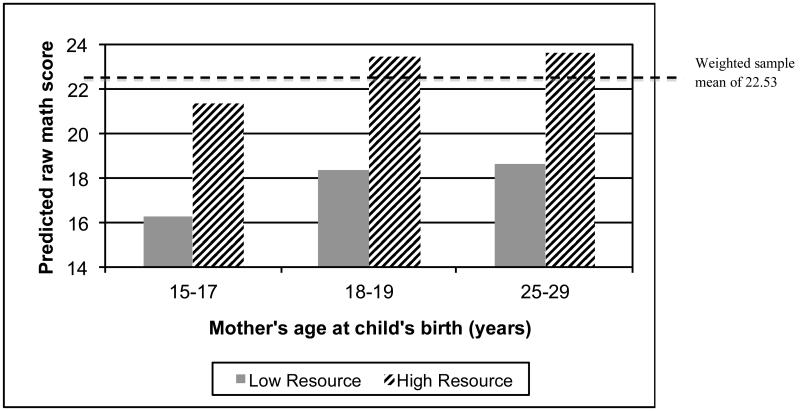
Figure III.
Predicted Preschool Math Scores, by Maternal Age and Available Resources
Notes: Source: Early Childhood Longitudinal Study-Birth Cohort, 2001-2005. N≈7650.
Predictions use estimates from Table 2, Model 4. Analyses account for sample design effects. Dashed line is sample mean.
Lower-resource is coded as below poverty line, mother’s education of 10 years, no health insurance, no bank account, 1 additional child in the household, socializes rarely with neighbors, and no child care at Wave 1. Higher-resource is coded as 200-299% of poverty line, mother’s education of 12 years, privately insured, bank account, 0 additional children in the household, socializes weekly with neighbors, and some free or subsidized child care at Wave 1.
Predicted values are computed using 15- to 19-year-old mothers’ weighted means/modes for all other variables.

