
Figure 2.

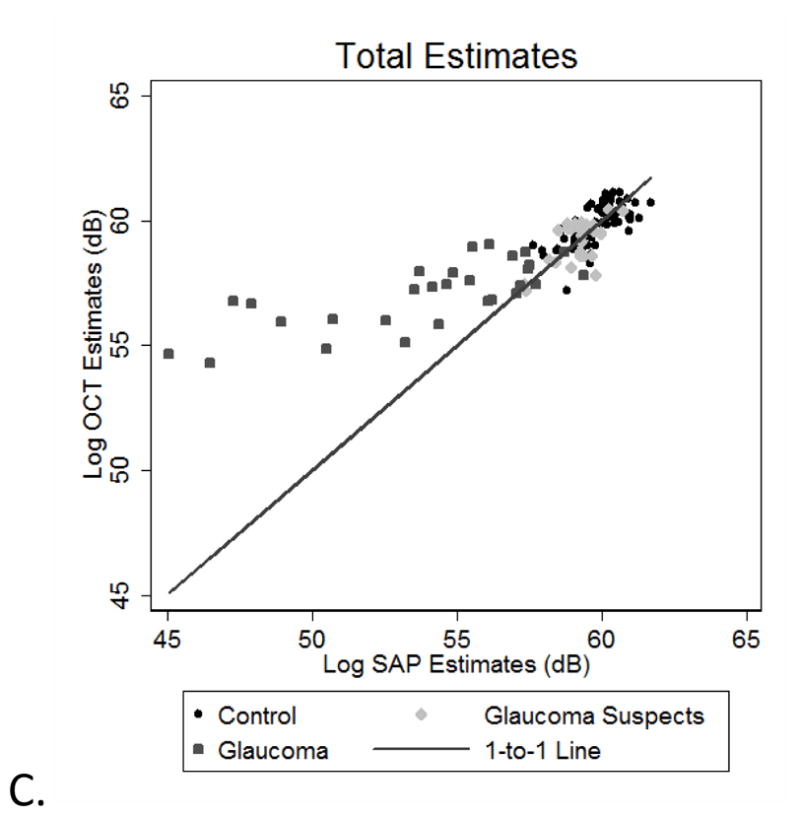
Inferior visual field vs. Superior OCT derived RGC estimates (A), Superior visual fields and Inferior OCT estimates (B), and total estimates (C) of RGC’s/axons from SAP and OCT measurements for all subjects. The solid line represents the one-to-one line. All appear to reveal agreement in normal and early glaucomatous damage, with increasing discordance between estimates with increasing glaucomatous damage.