
Figure 2. Imaging of RAGE Expression After Reperfusion.
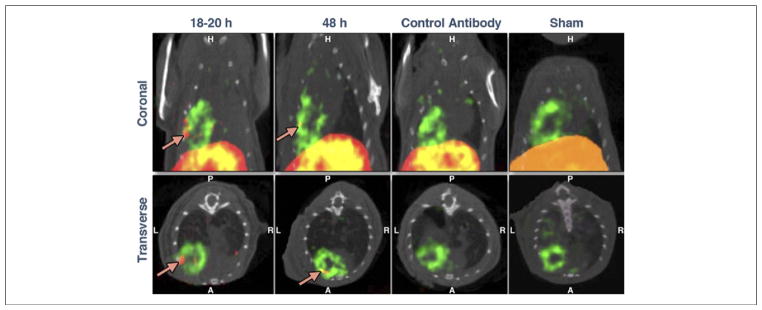
Representative coronal (top panels) and transverse (bottom panels) hybrid SPECT/CT images in mice with 30-min LAD occlusion and injected with 99mTc-labeled anti-RAGE F(ab′)2 and 201Tl at 18 to 20 h or at 48 h or with control nonspecific F(ab′)2 at 18 to 20 h after reperfusion. Uptake of 99mTc is designated by red and uptake of 201Tl by green. When merged, overlapping uptake of the 2 tracers becomes yellow. Uptake of the 99mTc-anti-RAGE F(ab′)2 is seen in the border of the apical defect (arrows) at both time points, although it is shown to be greater at 18 to 20 h after reperfusion. Disease and antibody controls showed no focal tracer uptake in the infarct zone. Abbreviations as in Figure 1.