
Figure 4. Bar Graphs of Biodistribution Data.
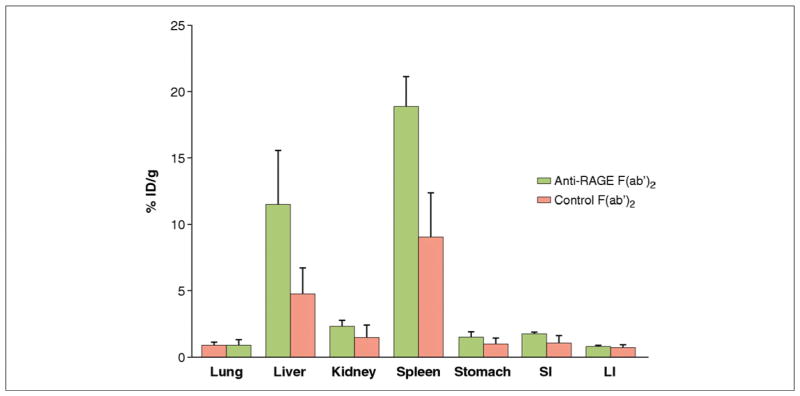
Bar graphs of biodistribution data showing mean percentage of injected dose per gram (%ID/g) in non-target organs of wild-type mice 6 h after tail vein injection of radiolabeled anti-RAGE F(ab′)2 (green bars) or control nonspecific F(ab′)2 (pink bars) at 18 to 20 h after reperfusion. Abbreviations as in Figure 1.