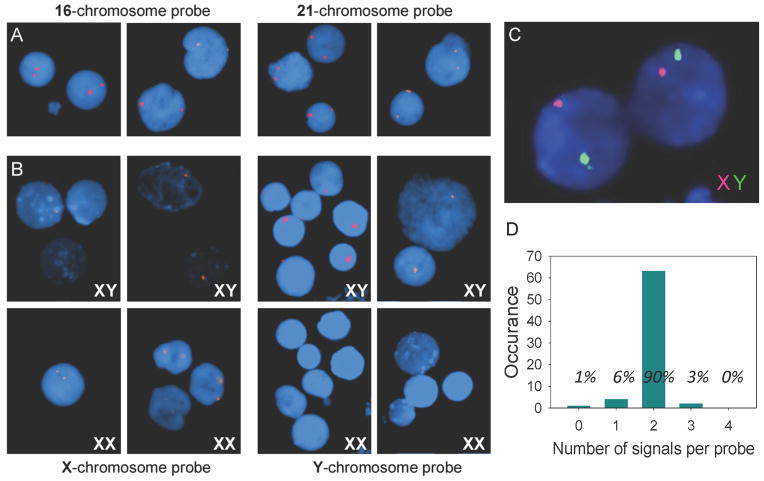
Figure 2. Fluorescent images of interphase nuclei observed by fluorescent microscopy.
(A) Typical results (double-spot signals) were observed on human nuclei with every one of the unique target sites randomly chosen for autosomal parts of the human genome. All nuclei display two very bright fluorescent spots when probes corresponding to chromosome16 (AGAGGAAGCTACACTGAGAGGAAG) or to chromosome 21 (GAGGGAGGTAATTGAGGGAGG) were applied. (B) Special probes were designed for sex chromosomes (X and Y) in order to confirm specificity of the developed method. In experiments with male cell lines (XY) both probes, X chromosome - probe (AGAGGAAGAGTCGGAGAGGAAG) and Y chromosome - probe (GGAGGAGAATGGGTCTGAGGGAAG), give only one signal. Two signals for the X-probe were observed in nuclei of female cell lines (XX) and no signal was observed for the Y-probe. (C) Simultaneous, two-color detection of sequences on the X- and the Y-chromosomes in male cells. Both X and Y-probes were applied, ligated and amplified with RCA. The amplification product from the Y-probe is hybridized with the green fluorescent decorator, while the product from the X-probe is hybridized with the red decorator. (D) Number of detection signals on cell nuclei obtained per probe. A total of 72 reactions were analyzed, and 65 resulted in the expected 2 detection signals per probe (corresponding to 90%). Five of the cells had one or no detection signals, while two of the cells displayed three detection signals per probe. See also Figures S4.

