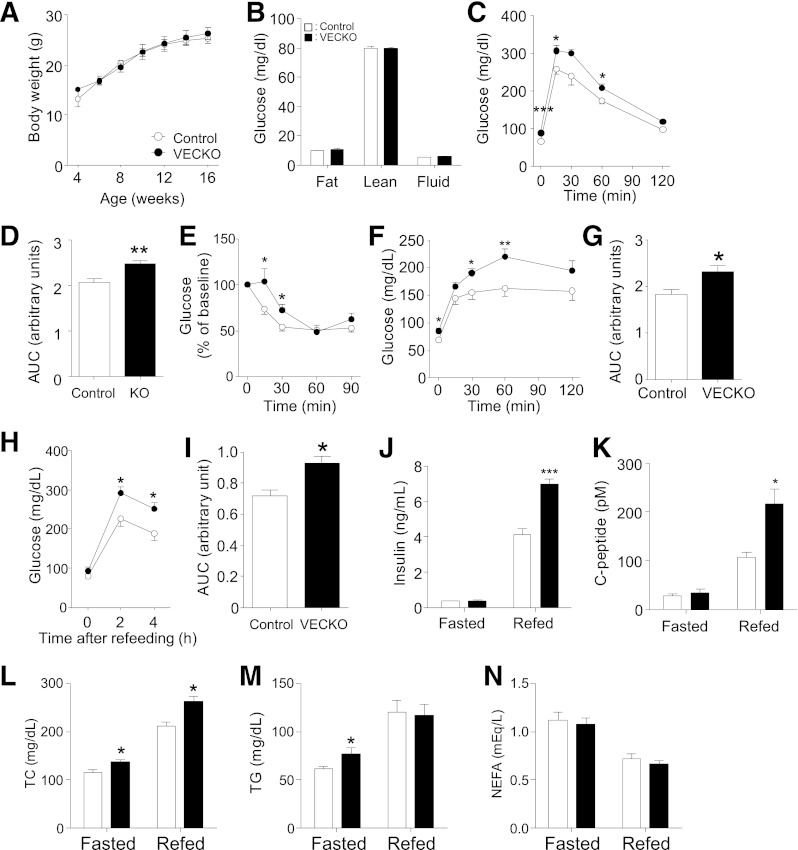
FIG. 1.
Metabolic characterization of SD-fed mice. Body weight (A) and body composition (B) in 12-week-old SD-fed WT and VECKO mice (n = 8–10). Intraperitoneal glucose tolerance tests (C) and area under curve (AUC) (D) in 11-week-old SD-fed WT and VECKO mice after an 18-h fast (n = 7–10). E: Intraperitoneal insulin tolerance tests in 12-week-old mice after 2-h fast (n = 5–7). Glucose levels (F) and area under the curve (G) in pyruvate tolerance tests after 18-h fast. Glucose (H), area under the curve (I), insulin (J), C-peptide (K), total cholesterol (TC) (L), triglyceride (TG) (M), and nonesterified fatty acid (NEFA) (N) levels in 13-week-old mice fed an SD and fasted for 16 h without refeeding (0 h, fasted) or fasted for 16 h and then refed for 4 h (refed) (n = 5–7). *P < 0.05, **P < 0.01, ***P < 0.001 vs. WT.

