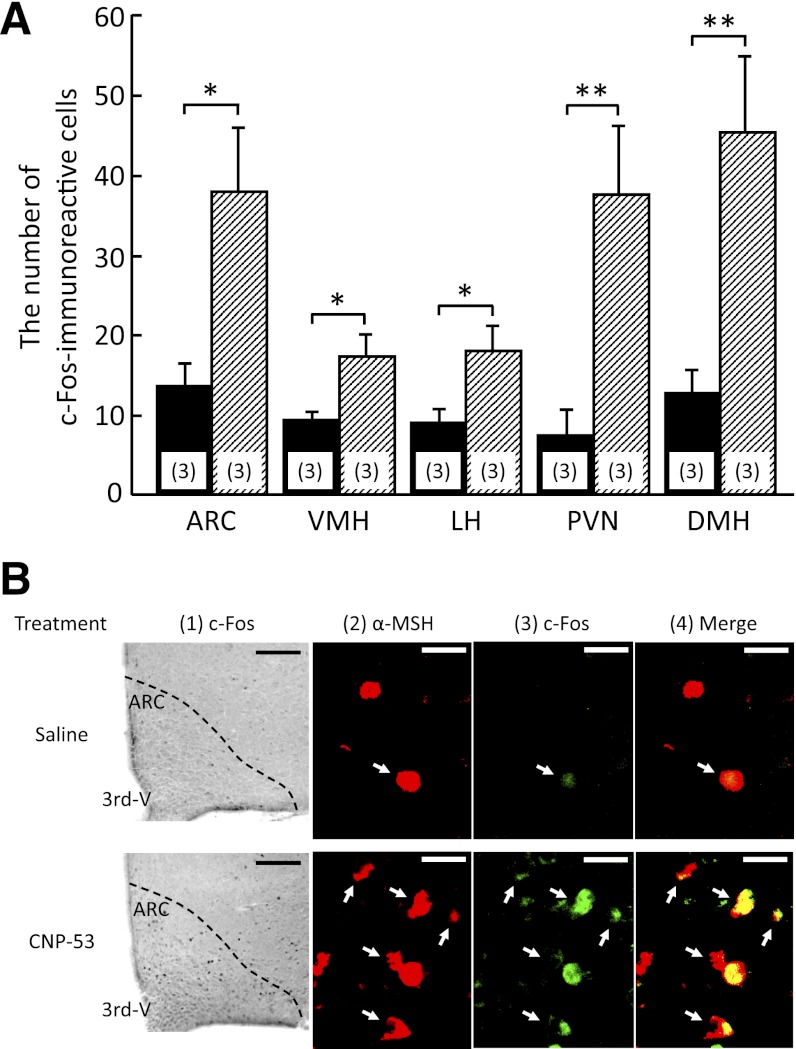
FIG. 4.
The c-Fos–immunoreactive cells in the hypothalamus after intracerebroventricular administration of CNP-53 (1.5 nmol/mouse). A: Number of c-Fos–immunoreactive cells after saline and CNP-53 treatments. Data represent mean ± SEM. The number of mice is given in parentheses. Significant differences: *P < 0.05, **P < 0.01. B: c-Fos–immunoreactive cells induced by intracerebroventricular administration of saline and CNP-53 (1). 3rd-V, the third ventricular. Scale bars, 100 μm. Coexistence of α-MSH (red) and c-Fos (green) immunoreactivity in the ARC (2–4) after saline (upper) and CNP-53 (1.5 nmol/mouse; lower) treatments. White arrows indicate cells expressing both α-MSH and c-Fos immunoreactivity. 3rd-V, the third ventricular. Scale bars, 20 μm.

