
FIG. 3.
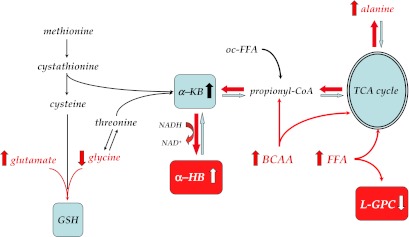
Reconstruction of the metabolic pathway featuring α-HB and L-GPC. Unmeasured metabolites are in italic, and statistically significant changes between progressors and nonprogressors are indicated in red. α-KB, α-ketobutyrate; GSH, glutathione; oc-FFA, odd-chain FFA. See text for further explanation.