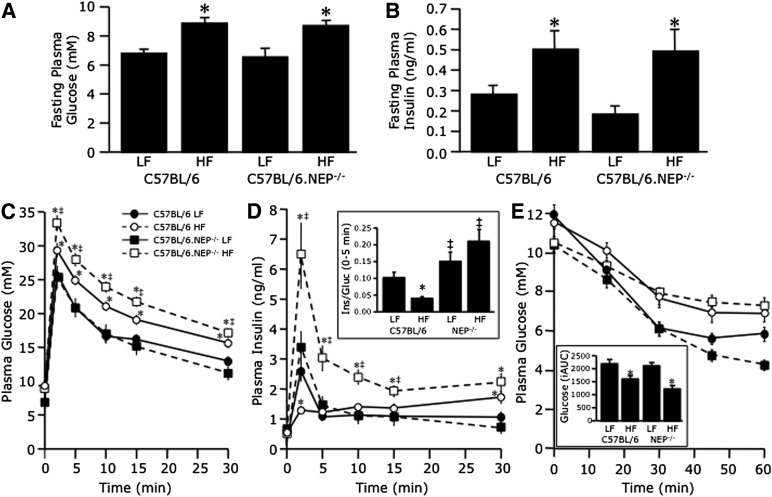
FIG. 7.
Neprilysin-deficient mice are protected against high-fat diet–induced insulin secretory dysfunction. Fasting plasma glucose (A) and insulin (B) levels and plasma glucose (C) and insulin (D) levels in response to intravenous glucose and plasma glucose levels in response to intraperitoneal insulin (E) in C57BL/6 and C57BL/6.NEP−/− mice after 12 weeks on a low-fat (LF) or high-fat (HF) diet. The inset in D shows the early insulin response to intravenous glucose calculated as a ratio of the incremental areas under the insulin and glucose curves over the first 5 min. The inset in E shows the inverse area under the curve below baseline glucose after insulin administration. Closed circles, C57BL/6 LF; open circles, C57BL/6 high fat; closed squares, C57BL/6.NEP−/− low fat; open squares, C57BL/6.NEP−/− high fat. Data are means ± SEM; n = 14–18. *P < 0.05 vs. LF; ‡P < 0.05 vs. C57BL/6.

