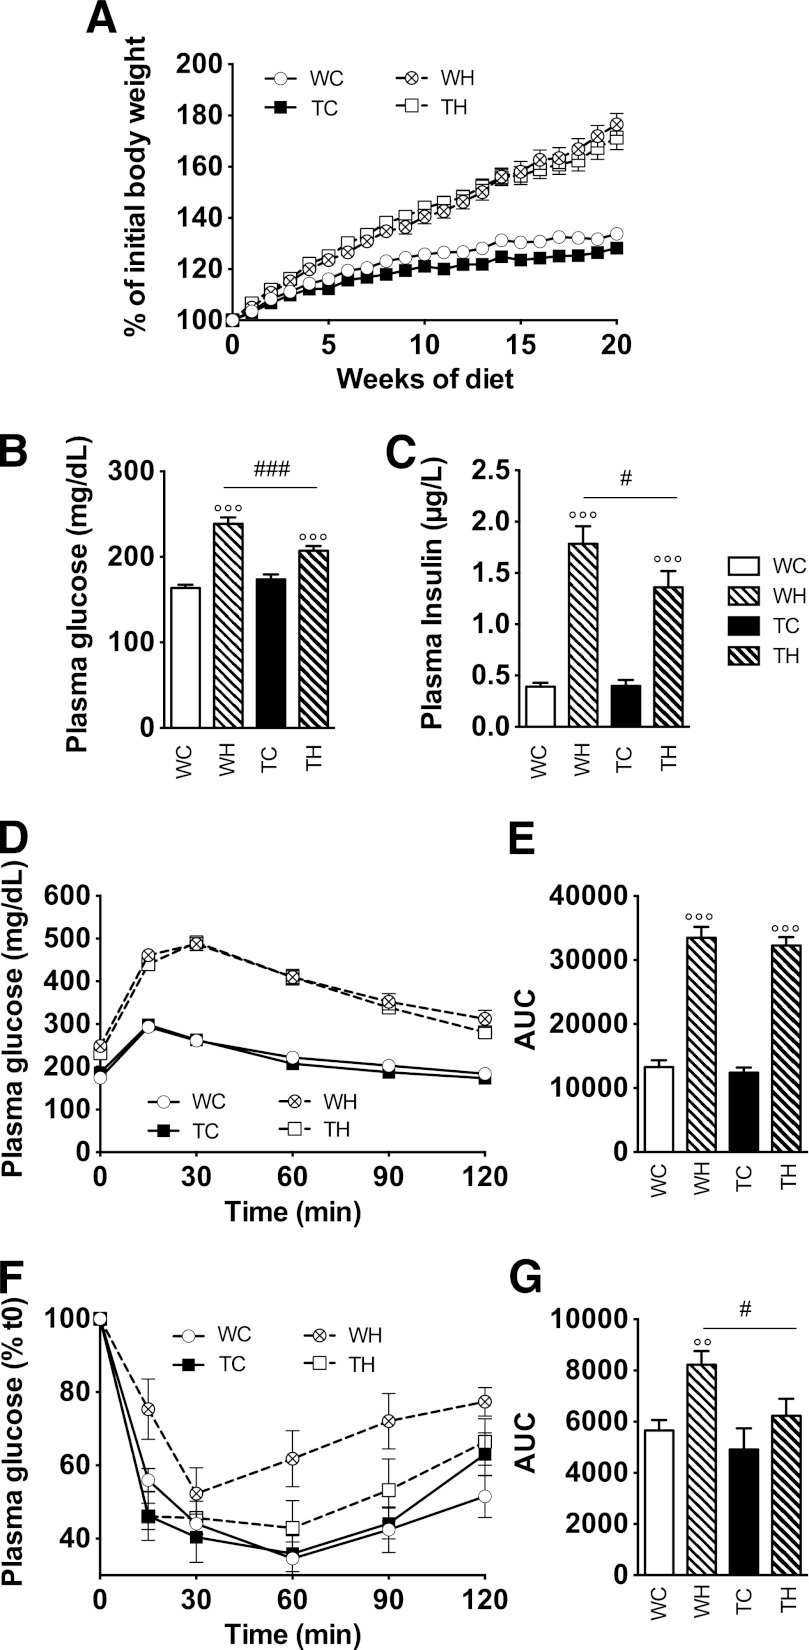
FIG. 1.
HFD leads to obesity in absence of insulin resistance in THY-Tau22 mice. A: Progressive establishment of a diet-induced obesity in WT and THY-Tau22 mice (WC vs. WH, P < 0.001; TC vs. TH, P < 0.001, using 2W-ANOVA). B and C: Glucose (B) and insulin (C) levels at completion of experiment. D and E: Intraperitoneal glucose tolerance test demonstrated significant and similar impairments in HFD-fed mice regardless of genotype (WC vs. WH and TC vs. TH, P < 0.001 using 2W-ANOVA). F and G: Insulin tolerance test demonstrated significant attenuation of glucose lowering following insulin injection in WH mice as compared with WC animals (P < 0.001 using 2W-ANOVA). Conversely, TH mice were not significantly different from TC animals (P = 0.20 vs. TC group using 2W-ANOVA). E and G represent areas under the curve (AUC) calculated from data presented in F and H, respectively. Results are expressed as means ± SEM. °°P < 0.01, °°°P < 0.001 vs. respective chow; #P < 0.05, ###P < 0.001 vs. TH mice using 1W-ANOVA. Open circles/open bars, WC; black squares/black bars, TC; crossed circles/dashed bars, WH; open squares/black dashed bars, TH.

