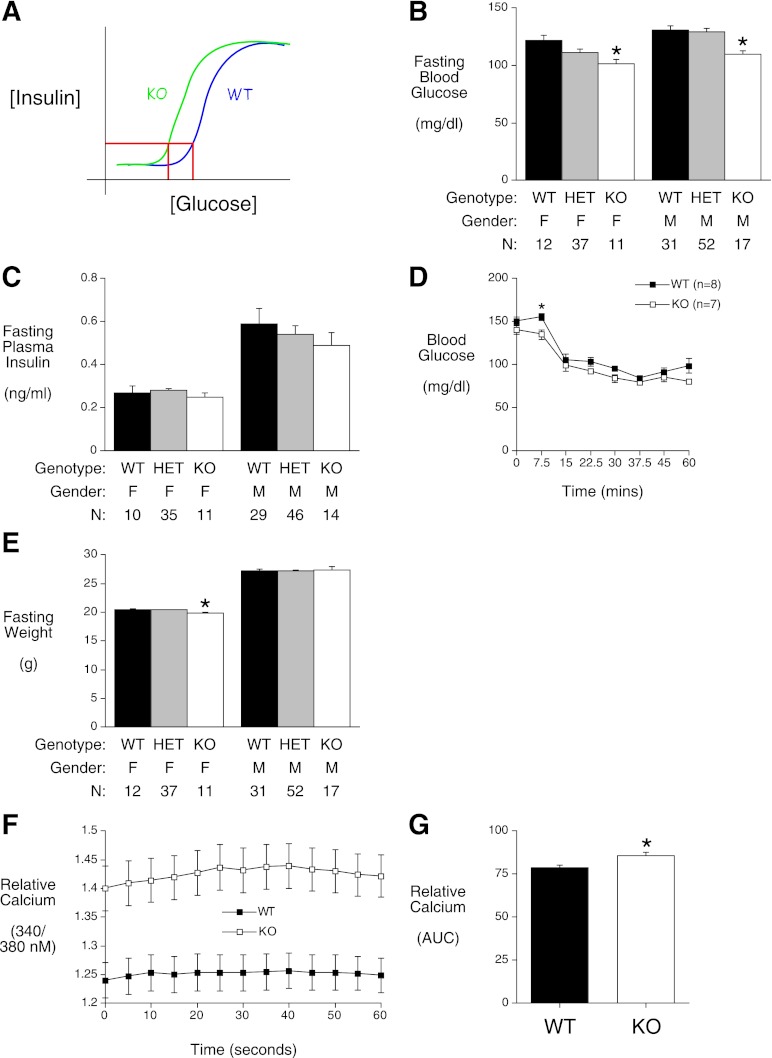
FIG. 4.
FBG is reduced in chow-fed G6pc2 KO mice. A: A schematic to explain the effect of G6pc2 deletion on FBG levels. The model proposes that in 6-h–fasted mice, in which insulin levels are the same in WT and G6pc2 KO mice (C), FBG is reduced in G6pc2 KO mice due to a leftward shift in the dose-response curve for GSIS relative to WT mice. B, C, and E: At 17 weeks of age, mice were fasted for 5 h and then weighed (E). Weight results are the mean ± SEM of data from the following number of animals: male WT, 31; male heterozygous (HET), 52: male KO, 17; female WT, 12; female HET, 37; and female KO, 11. One hour later, mice were anesthetized and blood isolated. Blood glucose (B) and plasma insulin (C) were determined as described in Research Design and Methods. Glucose results are the mean ± SEM of data from the following number of animals: male WT, 31; male HET, 52; male KO, 17; female WT, 12; female HET, 37; and female KO, 11. Insulin results are the mean ± SEM of data from the following number of animals: male WT, 29; male HET, 46; male KO, 14; female WT, 10; female HET, 35; and female KO, 11. D: Insulin tolerance tests using 0.75 units/kg insulin were performed on 5-h–fasted conscious ∼14-week-old WT and G6pc2 KO male mice as described in Research Design and Methods. The results show the mean glucose concentrations ± SEM determined using eight WT and seven KO animals. F and G: Cytoplasmic calcium levels at 5.6 mmol/L glucose were compared in dispersed cells generated from three independent WT and G6pc2 KO mouse islet preparations as described in Research Design and Methods. Results are the mean ± SEM of 288 measurements from WT cells and 236 measurements from KO cells. *P < 0.05 vs.WT. AUC, area under the curve; F, female; M, male.

