FIG. 7.
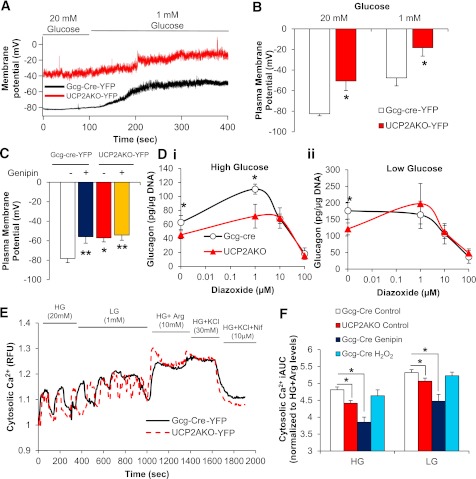
UCP2AKO α-cells have more depolarized plasma membranes and reduced intracellular calcium. A: Representative traces of plasma membrane potential in YFP+ α-cells incubated in high (20 mmol/L) and low (1 mmol/L) glucose. B: Average membrane potential in YFP+ α-cells. N = 5–8 cells, 3 mice/genotype. *P < 0.05. C: Average plasma membrane potential measured in YFP+ α-cells (N = 8–13) with or without genipin (50 µmol/L) (N = 5 cells), and at least 3 mice/genotype. *P < 0.05, **P < 0.01. D: Glucose-inhibited glucagon secretion from islets incubated with or without diazoxide (1, 10, and 100 µmol/L) in the presence of high glucose (20 mmol/L) (i) or low glucose (1 mmol/L) (ii). *P < 0.05. N = 3 mice/genotype. E: Representative traces of cytosolic calcium uptake in YFP+ α-cells switched from high glucose (HG) (20 mmol/L) to low glucose (LG) (1 mmol/L) and then in the presence of arginine (Arg) (10 mmol/L), KCl (30 mmol/L), and the l-type calcium blocker nifedipine (Nif) (10 µmol/L). F: Incremental area under the curve (iAUC) for cytosolic calcium, normalized to high glucose plus arginine levels. Representative traces are shown in Supplementary Fig. 8. *P < 0.05. N = 19–40 cells/treatment, 3 mice/genotype.

