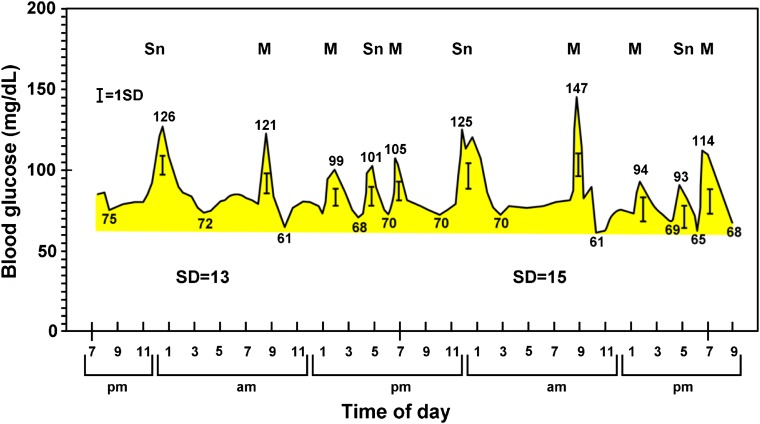
FIG. 1.
Continuous BG analysis for 48 h in an ambulatory fed normal subject. The timing and frequency of food ingestion matches that of the type 1 diabetic patient in Fig. 2. Note that each glucose excursion occurs in response to food ingestion and that each limb, ascending and descending, exceeds 1 SD of the 288 data points/24 h taken every 5 min from the 48-h tracing. Note the small difference in SD between days 1 and 2. Mean BG was 84 and 82 mg/dL and MAGE 41 and 48 for days 1 and 2, respectively. M, meal; Sn, snack.

