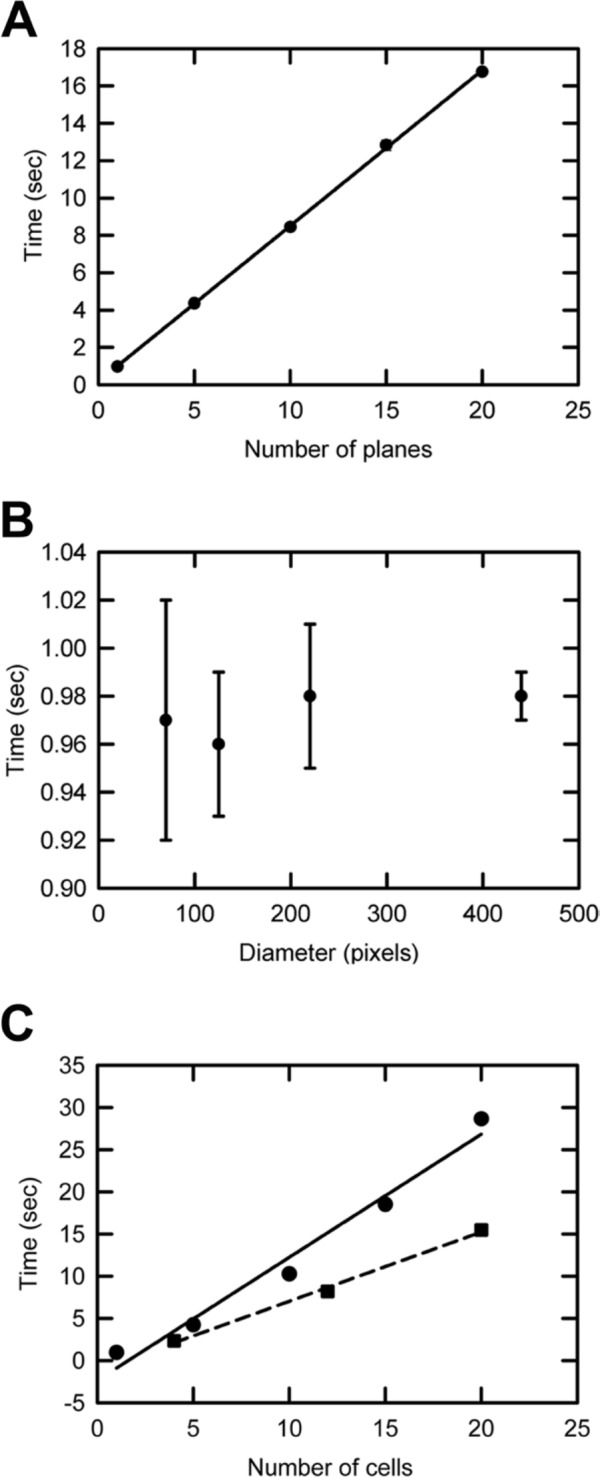
Figure 4.

Testing the performance of the MATLAB program using synthetic data. (A) Program execution times were measured when the number of images in the z-stacks varied. Each image in the z-stack consisted of 512 × 512 pixels. A circular disk with a diameter of 220 pixels was used as the test object in each image of the z-stack. The number of contours used in each image in the z-stack was 10. The execution time scales linearly with the number of planes (R 2 = 0.99, n=3). The error bars are one unit of standard deviation of the mean values and are smaller than the symbols representing the data points. (B) The mean values of the execution times, to scan 10 contours around circular disks of varying diameters in single-plane images of 512 × 512 pixels each (n=3), were recorded. The error bars are one unit of standard deviations of the mean values. (C, solid line) The durations of the program to perform the loop calculations for varying numbers of circular disks of fixed diameter in single-plane images of 512 × 512 pixels each are illustrated here. The diameter of a single circular disk in these images is 45 pixels. The execution time of the program scales linearly with the number of disks (R 2 = 0.98, n=3). (C, dashed line) The dashed line represents the linear scaling of the execution time with the number of disks for the custom-built parallel program (R 2 = 0.99, n=3). The parallel program is significantly faster than the serial program (solid line). The error bars are one unit of standard deviations of the mean values and are smaller than the symbols used to represent the data points. The execution times were calculated using the standard MATLAB commands to measure time.
