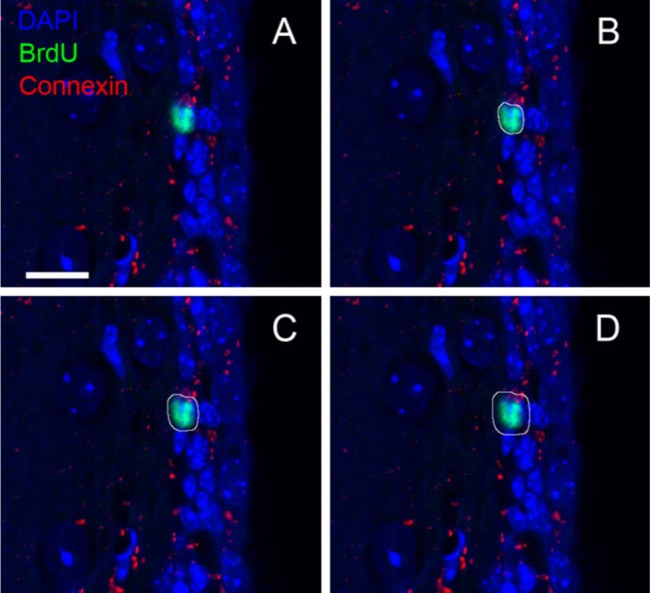
Figure 5.

Application of contour expansion algorithm to a representative confocal z-stack image. The z-stack consists of 10 images, and each image consists of 512 × 512 pixels. The x and y pixel scaling is 0.1 µm each, and the axial pixel scaling is 1.0 µm. (B–D) The white loops around the BrdU (green)-stained nucleus (blue) are the contours created by the MATLAB program, labeled as L1, L5, and L10, respectively (Table 1). L1 consists of pixels adjacent to the surface pixels of the nucleus. The surface pixels are obtained following nuclear segmentation using FARSIGHT. The contours sweep the neighborhood of the nucleus starting at the nuclear surface, where each contour is one pixel wide in an eight-neighborhood sense. Similar contours are created with respect to the nuclear surface in all images in the z-stack containing a cross section of the nucleus (Movie 2 [supplemental material]). Bar = 10 µm.
