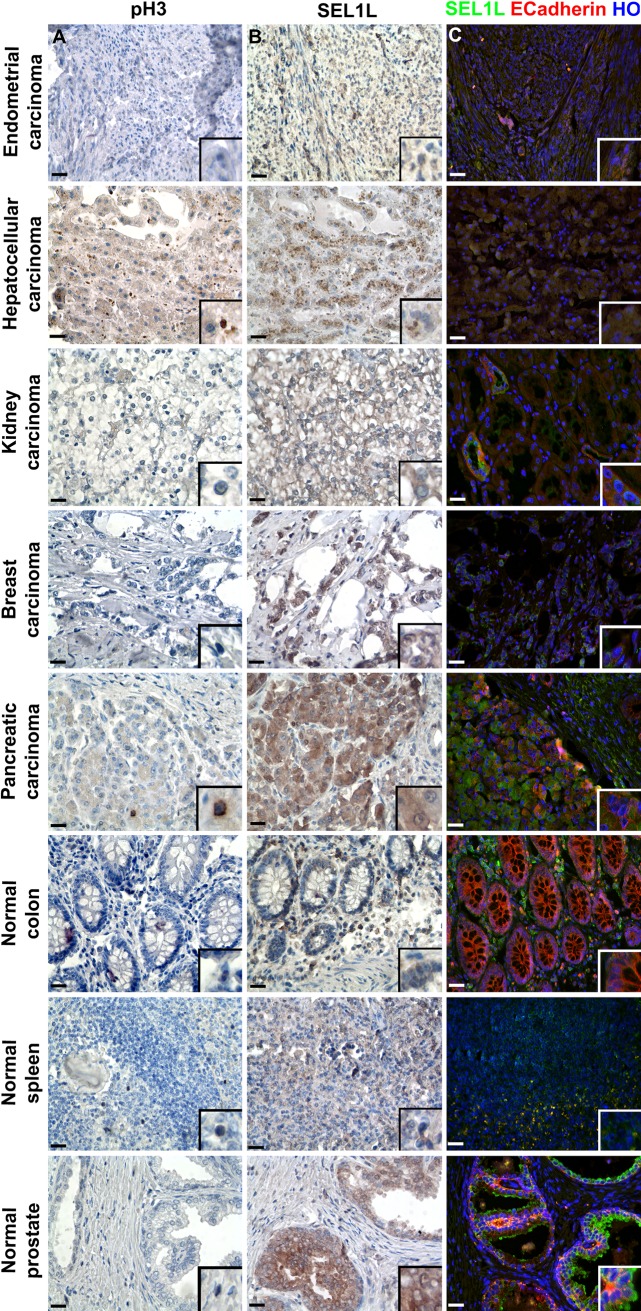
Figure 2.
Immunophenotypical analysis of tissue microarray (TMA) slices to identify nuclear, cytoplasmic, and membrane antigens. Five different tumoral and three normal tissues were used to construct a TMA, from which three sequential slices were analyzed for pH3 (A) and SEL1L (B; monoclonal antibody described by Orlandi et al. 2002) expression by immunohistochemistry and concurrently for SEL1L and E-cadherin (C) by immunofluorescence. The immunohistochemical figures show SEL1L and H3 proteins in brown, whereas nuclei were counterstained with hematoxylin. In the immunofluorescence study, SEL1L is depicted in green, E-cadherin in red, and nuclei in blue (counterstaining with Hoechst 33258, HO). Scale bars = 25 µm.

