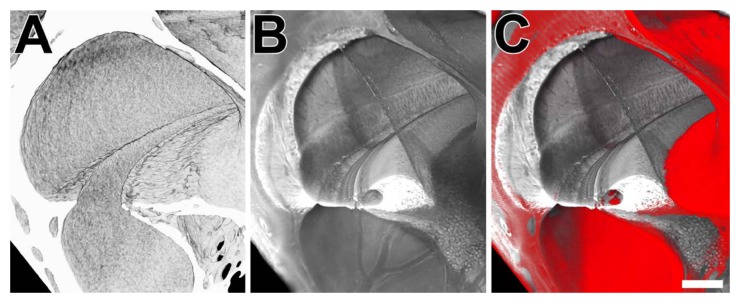
Figure 8.

Panel A is a microCT volume rendering of the scalae (mouse, right side). Panel B is an sTSLIM volume rendering of the scalae (mouse, left side; flipped) showing the soft tissue. Panel C is a combination of both volume renderings showing the microCT rendering in pseudo-color red and the sTSLIM rendering in grey. Bar = 100 µm.
